Software > OpenVMS Systems > Documentation > 731final > 6549 HP OpenVMS Systems Documentation |
OpenVMS Alpha System Analysis Tools Manual
Chapter 6
|
The Spinlock Tracing utility is still under development. The command format, displays, and suggested approach to spinlock analysis are all subject to change. |
The following steps will enable you to collect spinlock statistics using the Spinlock Tracing Utility.
SDA> SPL LOAD |
SDA> SPL START TRACE |
SDA> SPL SHOW TRACE/SUMMARY |
SDA> SPL START COLLECT/SPINLOCK=SCHED |
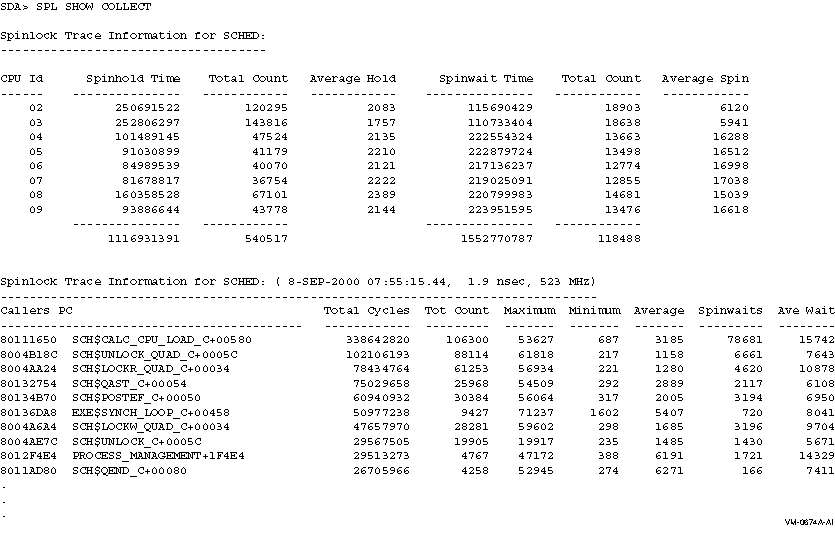
SDA> SPL SHOW COLLECT |
SDA> SPL STOP COLLECT SDA> SPL STOP TRACE SDA> SPL UNLOAD |
The following example shows a command procedure that can be used for gathering spinlock statistics:
$ analyze/system spl load spl start trace/buffer=1000 spawn wait 00:00:15 spl stop trace read/executive/nolog set output spl_trace.lis spl show trace/summary spl start collect/spin=sched spawn wait 00:00:05 spl show collect spl start collect/spin=iolock8 spawn wait 00:00:05 spl show collect spl start collect/spin=lckmgr spawn wait 00:00:05 spl show collect spl start collect/spin=mmg spawn wait 00:00:05 spl show collect spl start collect/spin=timer spawn wait 00:00:05 spl show collect spl start collect/spin=mailbox spawn wait 00:00:05 spl show collect spl start collect/spin=perfmon spawn wait 00:00:05 spl show collect spl stop collect spl unload exit $ exit |
A more comprehensive procedure is provided as SYS$EXAMPLES:SPL.COM.
The following is a list of the spinlock tracing commands:
SPL LOAD
SPL SHOW COLLECT
SPL SHOW TRACE
SPL START COLLECT
SPL START TRACE
SPL STOP COLLECT
SPL STOP TRACE
SPL UNLOAD
Loads the SPL$DEBUG execlet. This must be done prior to starting spinlock tracing.
SPL LOAD
None.
None.
The SPL LOAD command loads the SPL$DEBUG execlet, which contains the tracing routines.
SDA> SPL LOAD
SPL$DEBUG load status = 00000001
|
Displays the collected spinlock data.
SPL SHOW COLLECT [/RATES|/TOTALS]
None.
/RATES
Reports activity as a rate per second and hold/spin time as a percentage of time. This is the default./TOTALS
Reports activity as a count and hold/spin time as cycles.
The SPL SHOW COLLECT command displays the collected spinlock data. It displays first a summary on a per-CPU basis, followed by the callers of the specific spinlock. This second list is sorted by the top consumers of the spinlock (in percent of time held). These displays show average spinlock hold and spinlock wait time in system cycles.Example

Displays spinlock tracing information.
SPL SHOW TRACE [/[NO]SPINLOCK=spinlock|/[NO]FORKLOCK=forklock
|/[NO]ACQUIRE|/RATES |/[NO]RELEASE|/[NO]WAIT
|/[NO]FRKDSPTH|/[NO]FRKEND
|/SUMMARY|/CPU=n |/TOP=n|/TOTALS]
None.
/SPINLOCK=spinlock
The /SPINLOCK=n qualifier specifies the display of a specific spinlock, for example, /SPINLOCK=LCKMGR or /SPINLOCK=SCHED.
/NOSPINLOCKThe /NOSPINLOCK qualifier specifies that no spinlock trace information be displayed. If omitted, all spinlock trace entries are decoded and displayed.
/FORKLOCK=forklock
The /FORKLOCK=forklock qualifier specifies the display of a specific forklock, for example, /FORKLOCK=IOLOCK8 or /FORKLOCK=IPL8.
/NOFORKLOCKThe /NOFORKLOCK qualifier specifies that no forklock trace information be displayed. If omitted, all fork trace entries are decoded and displayed.
/ACQUIRE
The /ACQUIRE qualifier displays any spinlock acquisitions.
/NOACQUIREThe /NOACQUIRE qualifier ignores any spinlock acquisitions.
/RATES
Reports activity as a rate per second and hold/spin time as a percentage of time. This is the default./RELEASE
The /RELEASE qualifier displays any spinlock releases.
/NORELEASEThe /NORELEASE qualifier ignores any spinlock releases.
/TOTALS
Reports activity as a count and hold/spin time as cycles./WAIT
The /WAIT qualifier displays any spinwait operations.
/NOWAITThe /NOWAIT qualifier ignores any spinwait operations.
/FRKDSPTH
The /FRKDSPTH qualifier displays all invocations of fork routines within the fork dispatcher. This is the default.
/NOFRKDSPTHThe /NOFRKDSPTH qualifier ignores all of the operations of the /FRKDSPTH qualifier.
/FRKEND
The /FRKEND qualifier displays all returns from fork routines within the fork dispatcher. This is the default.
/NOFRKENDThe /NOFRKEND qualifier ignores all operations of the /FRKEND qualifier.
/CPU=n
Specifies the display of information for a specific CPU only, for example, /CPU=5 or /CPU=PRIMARY. By default, all trace entries for all CPUs are displayed./SUMMARY
Steps through the entire trace buffer and displays a summary of all spinlock and forklock activity. It also displays the top ten callers./TOP=n
Displays a different number other than the top ten callers or fork PCs. By default, the top ten are displayed. This qualifier is only useful when you also specify the /SUMMARY qualifier.
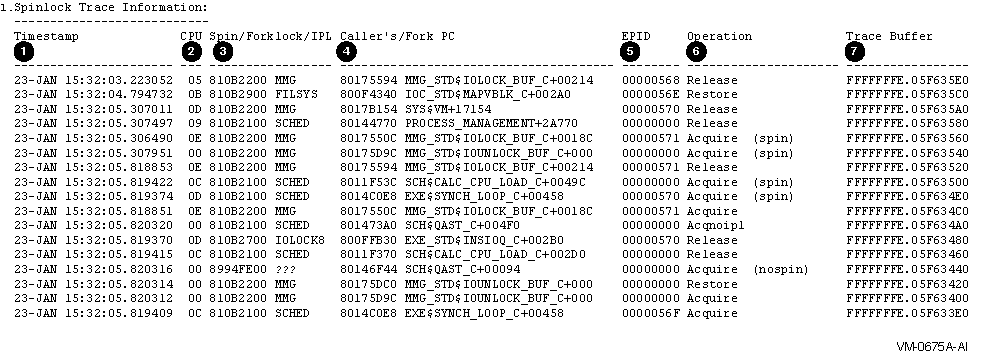
The SPL SHOW TRACE command displays spinlock tracing information. The latest acquired or released spinlock is displayed first, and then the trace buffer is stepped backwards in time.By default, all trace entries will be displayed, but you can use qualifiers to select only certain entries.
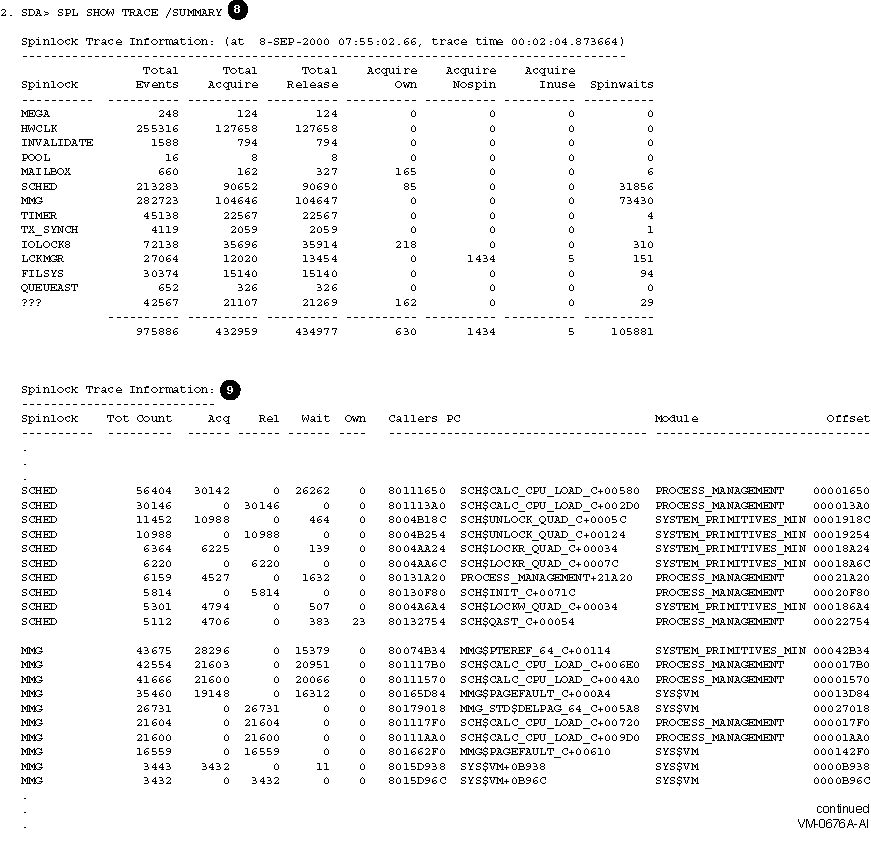
Since this is not a time critical activity and a table lookup has to be done anyway to translate the SPL address to a spinlock name, commands like /SPINLOCK=(SCHED,IOLOCK8) do work. /SUMMARY will step the entire trace buffer and display a summary of all spinlock activity, along with the top-ten callers' PCs. You can use /TOP=n to display a different number of the top ranked callers.
Examples

| Callout | Meaning |
|---|---|
| 1 | Shows timestamps that are collected as system cycle counters (SCC) and then displayed with an accuracy down to microseconds. Each CPU is incrementing its own SCC as soon as it is started, so there is some difference between different CPUs' system cycle counters. The standard system time is incremented only every 10 Msec and as such is not exact enough. Adjusting the SCC to the specific CPU's system time and translating it into an accurate timestamp will thus sometimes display times out of order for different CPUs. However, for the same CPU ID, the timestamps are accurate. |
| 2 | Shows the physical CPU ID of the CPU logging the trace entry. |
| 3 | Shows the address of the spinlock fork. If it is a static one, its name is displayed; otherwise, it is marked as ???. |
| 4 | Shows the caller's PC address that acquired or released the spinlock, or the fork PC if the trace entry is a forklock. Symbolization is attempted, so a READ/EXECUTIVE might help to display a routine name, instead of simply a module and offset. |
| 5 | Shows the EPID, which is the external PID of the process generating the trace entry. If an interrupt or fork was responsible for the entry, then a zero EPID is displayed. |
| 6 | Shows the trace operation. For a spinlock, which was acquired without going through a spinwait, there is a matching acquire/release pair of trace entries for the same CPU ID for a given spinlock. If a spinlock is held, it cannot be acquired immediately, so there is also a spinwait trace entry for this pair. The different variations of the acquire and release operations are distinguished, as are the same spinlocks if they are acquired recursively multiple times. |
| 7 | Shows the address of the trace buffer entry, in case there is a need to access the raw and undecoded trace data. |

| Callout | Meaning |
|---|---|
| 8 | Shows the summary information by stepping through the whole trace buffer, and displaying a single line of information for each spinlock. If the percent of spin wait is very high, then a spinlock is a candidate for high contention. |
| 9 | For each spinlock in the summary display, the top ten callers' PCs are displayed along with the number of spinlock acquisitions and releases, as well as spinwait counts and the number of multiple acquisitions of the same spinlock. |

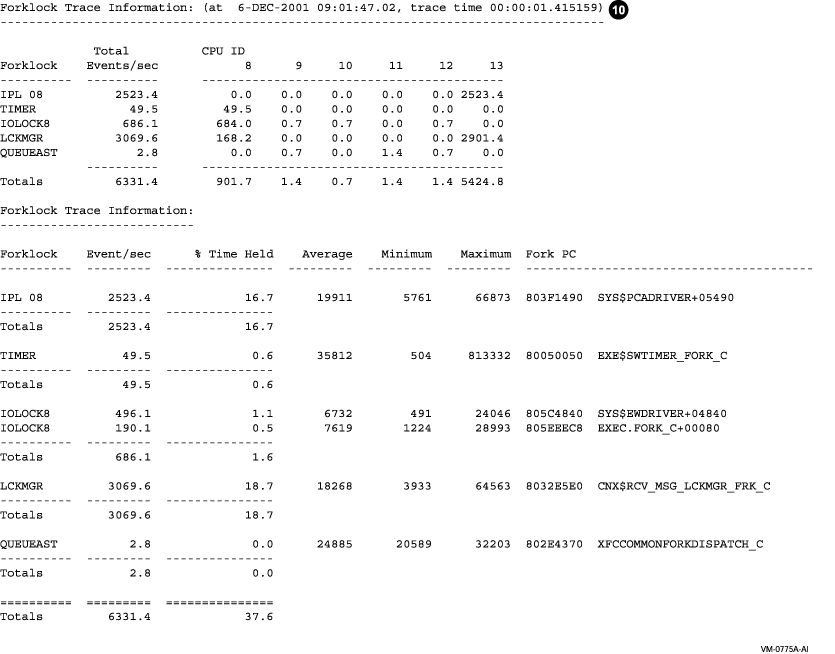
| Callout | Meaning |
|---|---|
| 10 | The forklock summary displays the number of fork operations on a specific CPU for each forklock. For each forklock, the top ten fork PC addresses are displayed, along with the minimum, maximum and average duration of the fork operation in system cycles. The percent of time spent in a given fork routine is displayed along with the percent of time for the forklock. |
Starts to collect spinlock information a longer period of time than will fit into the trace buffer.
SPL START COLLECT [/SPINLOCK=spinlock|/ADDRESS=n]
None.
/SPINLOCK=spinlock
Specifies the tracing of a specific spinlock, for example, /SPINLOCK=LCKMGR or /SPINLOCK=SCHED./ADDRESS=n
Specifies the tracing of a specific spinlock by address.
The SPL START COLLECT command starts a collection of spinlock information for a longer period of time than will fit into the trace buffer. You need to enable spinlock tracing before a spinlock collection can be started. On a system with heavy activity, the trace buffer typically can only hold a relatively small time window of spinlock information. In order to collect spinlock information over a longer time period, a collection can be started. The collection tries to catch up with the running trace index and save the spinlock information into a balanced tree within the virtual address space of the process performing the spinlock collection. Either use the name of a static spinlock, or supply the address of a dynamic spinlock, for which information should be gathered.The trace entries are kept in the trace buffer, which is allocated from S2 space, hence there is no disruption, if tracing is started from within SDA and then the user exits from SDA. However, for the longer period data collection, the information is kept in process-specific memory, thus a user needs to stay within SDA; otherwise the data collection is automatically terminated by SDA's image rundown. You can collect data for two or more spinlocks simultaneously, by using a separate process for each collection.
| #1 |
|---|
SDA> SPL START COLLECT
Use /SPINLOCK=name or /ADDRESS=n to specify which spinlock info needs to be collected...
|
This example shows that you need to supply either a spinlock name of a static spinlock, or the address of a dynamic spinlock, if you want to collect information over a long period of time.
| #2 |
|---|
SDA> SPL START COLLECT/SPINLOCK=LCKMGR
|
This example shows the command line to start to collect information on the usage of the LCKMGR spinlock.
Enables spinlock tracing.
SPL START TRACE [/[NO]SPINLOCK=spinlock|/[NO]FORKLOCK=forklock
|/BUFFER=pages|/[NO]ACQUIRE|
|/[NO]RELEASE|/[NO]WAIT|/[NO]FRKDSPTH
|/[NO]FRKEND|/CPU=n]
None.
/SPINLOCK=spinlock
The /SPINLOCK=spinlock qualifier specifies the tracing of a specific spinlock, for example, /SPINLOCK=LCKMGR or /SPINLOCK=SCHED.
/NOSPINLOCKThe /NOSPINLOCK qualifier disables spinlock tracing and does not collect any spinlock data. If omitted, all spinlocks are traced.
/FORKLOCK=forklock
The /FORKLOCK=forklock qualifier specifies the tracing of a specific forklock, for example, /FORKLOCK=IOLOCK8 or /FORKLOCK=IPL8.
/NOFORKLOCKThe /NOFORKLOCK qualifier disables forklock tracing and does not collect any forklock data. If omitted, all forks are traced.
/BUFFER=pages
Specifies the size of the trace buffer (in Alpha page units). It defaults to 128 pages, which is equivalent to 1MB, if omitted./ACQUIRE
The /ACQUIRE qualifier traces any spinlock acquisitions. This is the default.
/NOACQUIREThe /NOACQUIRE qualifier ignores any spinlock acquisitions.
/RELEASE
The /RELEASE qualifier traces any spinlock releases. This is the default.
/NORELEASEThe /NORELEASE qualifier ignores any spinlock releases.
/WAIT
The /WAIT qualifier traces any spinwait operations. This is the default.
/NOWAITThe /NOWAIT qualifier ignores any spinwait operations.
/FRKDSPTH
The /FRKDSPTH qualifier traces all invocations of fork routines within the fork dispatcher. This is the default.
/NOFRKDSPTHThe /NOFRKDSPTH qualifier ignores all of the /FRKDSPTH operations.
/FRKEND
The /FRKEND qualifier traces all returns from fork routines within the fork dispatcher. This is the default.
/NOFRKENDThe /NOFRKEND qualifier ignores all of the operations of the /FRKEND qualifier.
/CPU=n
Specifies the tracing of a specific CPU only, for example, /CPU=5 or /CPU=PRIMARY. By default, all CPUs are traced.
The SPL START TRACE command enables spinlock and fork tracing. By default all spinlocks and forks are traced and a 128 page (1MByte) trace buffer is allocated and used as a ring buffer.
| #1 |
|---|
SDA> SPL START TRACE/BUFFER=1000
Tracing started... (Spinlock = 00000000, Forklock = 00000000)
|
This example shows how to enable a tracing for all spinlock and forklock operations into a 8 MByte trace buffer.
| #2 |
|---|
SDA> SPL START TRACE/CPU=PRIMARY/SPINLOCK=SCHED /NOFORKLOCK
Tracing started... (Spinlock = 810AF600, Forklock = 00000000)
|
This example shows how to trace only SCHED spinlock operations on the primary CPU.
| #3 |
|---|
SDA> SPL START TRACE /NOSPINLOCK /FORKLOCK=IPL8
Tracing started... (Spinlock = 00000000, Forklock = 863A4C00)
|
This example shows how to trace only fork operations to IPL8.
| Previous | Next | Contents | Index |