Compaq Availability Manager User's Guide
3.2.3.3 OpenVMS Memory Details
When you click the View menu on the OpenVMS Memory Summary page (see
Figure 3-9), the following options are displayed in a popup menu:
- Memory Summary View
- Memory Details View
To display memory details, select that option. The Availability Manager
displays the OpenVMS Memory Details page (Figure 3-10).
Figure 3-10 OpenVMS Memory Details Page
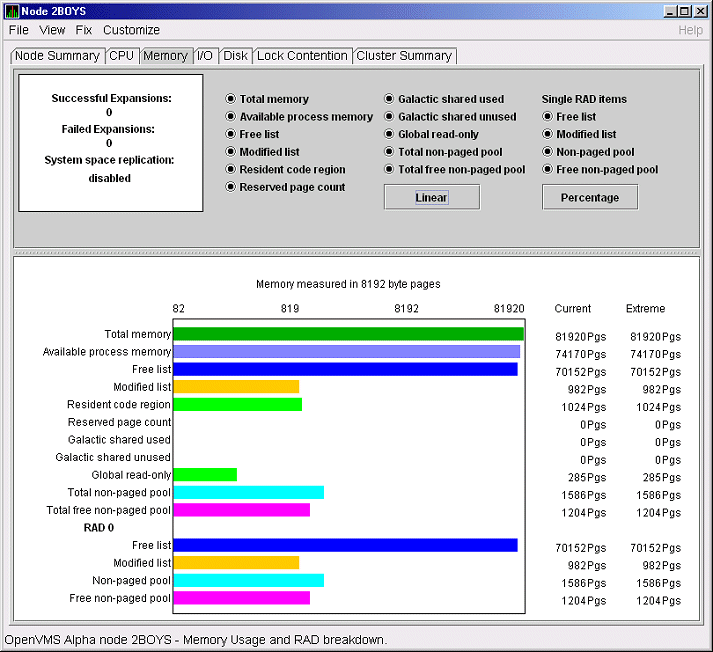
The following data items are in a box at the top left of the page:
| Heading |
Description |
|
Successful Expansions
|
Number of successful nonpaged pool expansions.
|
|
Failed Expansions
|
Number of failed attempts to expand nonpaged pool.
|
|
System space replication
|
Whether system space replication is enabled or disabled.
|
To the right of the box is a list of system memory data that is
displayed in the bar graphs at the bottom of the page. You can toggle
these data items on or off (that is, to display them or not to display
them as bar graphs). You can also click a small box to choose between
Linear and Logarithmic bar graph displays.
The system memory data items are described in Table 3-4.
Table 3-4 System Memory Data
| Data |
Description |
|
Total memory
|
Total physical memory size, as seen by OpenVMS.
|
|
Available process memory
|
Amount of total physical memory available to processes. This is the
total memory minus memory allocated to OpenVMS.
|
|
Free list
|
Size of the free page list.
|
|
Modified list
|
Size of the modified page list.
|
|
Resident code region
|
Size of the resident image code region.
|
|
Reserved page count
|
Number of reserved memory pages.
|
|
Galactic shared used
|
Galaxy shared memory pages currently in use.
|
|
Galactic shared unused
|
Galaxy shared memory pages currently not in use.
|
|
Global read-only
|
Read-only pages, which are installed as resident when system space
replication is enabled, that will also be replicated for improved
performance.
|
|
Total nonpaged pool
|
Total size of system nonpaged pool.
|
|
Total free nonpaged pool
|
Amount of nonpaged pool that is currently free.
|
To the right of the system memory data is a list of single RAD data
items, which are described in Table 3-5. You can toggle these items
to display them or not in bar graphs.
Table 3-5 Single RAD Data Items
| Data |
Description |
|
Free list
|
Size of the free page list.
|
|
Modified list
|
Size of the modified page list.
|
|
Nonpaged pool
|
Total size of system nonpaged pool.
|
|
Free nonpaged pool
|
Amount of nonpaged pool that is currently free.
|
Below the list of single RAD items is a box where you can toggle
between Percentage and Raw Data to display Current and Extreme values
to the right of the bar graphs.
By clicking the I/O tab on any OpenVMS node data page, you can display
a page that contains summaries of accumulated I/O rates. In the top
pane, the summary covers all processes; in the bottom pane, the summary
is for one process.
From the View menu, you can also choose to display (in the bottom pane)
a list of page and swap files.
The OpenVMS I/O Summaries page displays the rate, per second, at which
I/O transfers take place, including paging write I/O (WIO), direct I/O
(DIO), and buffered I/O (BIO). In the top pane, the summary is for all
CPUs; in the bottom pane, the summary is for one process.
When you double-click a data item under the DIO or BIO heading on the
Node pane, or if you click the I/O tab, the Availability Manager displays, by
default, the OpenVMS I/O Summaries (Figure 3-11).
Figure 3-11 OpenVMS I/O Summaries Page
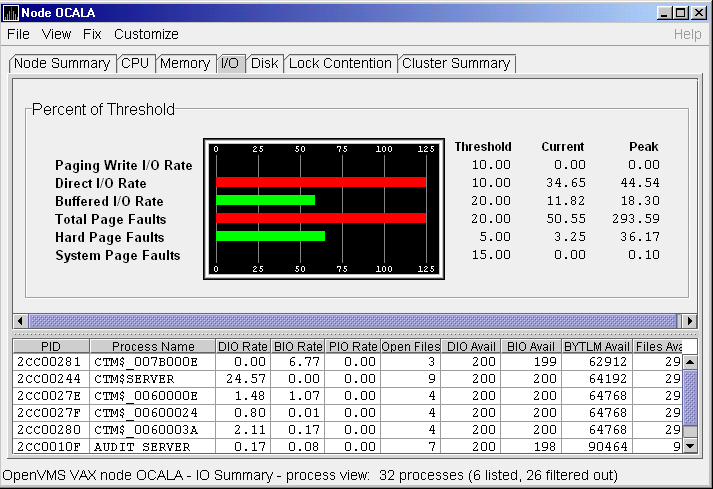
The graph in the top pane represents the percentage of thresholds for
the types of I/O shown in Table 3-6. The table also shows the event
that is related to each data item. (Refer to Section 7.5 for
information about setting event thresholds.)
Table 3-6 I/O Data Displayed
| Type of I/O |
I/O Description |
Related Event |
|
Paging Write I/O Rate
|
Rate of write I/Os to one or more paging files.
|
HIPWIO
|
|
Direct I/O Rate
|
Transfers are from the pages or pagelets containing the process buffer
that the system locks in physical memory to the system devices.
|
HIDIOR
|
|
Buffered I/O Rate
|
Transfers are for the
process buffer from an intermediate buffer from the system buffer pool.
|
HIBIOR
|
|
Total Page Faults
|
Total of hard and soft page faults on the system, as
well as peak values seen during an Availability Manager session.
|
HITTLP
|
|
Hard Page Faults
|
Total of hard page faults on the system.
|
HIHRDP
|
|
System Page Faults
|
Page faults that are taken from kernel processes.
|
HISYSP
|
Current and peak values are listed for each type of I/O.
Values that exceed thresholds set by the events indicated in the table
are displayed in red on the screen. Appendix B describes OpenVMS and
Windows events.
To the right of the graph, the following values are listed:
| Value |
Description |
|
Threshold
|
Defined in Event Properties.
|
|
Current
|
Current value or rate.
|
|
Peak
|
Highest value or rate seen since start of data collection.
|
The bottom pane displays summary accumulated I/O rates on a per-process
basis. The following data is displayed:
| Data |
Description |
|
PID
|
Process identifier. A 32-bit value that uniquely identifies a process.
|
|
Process Name
|
Name of the current process.
|
|
DIO Rate
|
Direct I/O rate. The rate at which I/O transfers occur between the
system devices and the pages or pagelets that contain the process
buffer that the system locks in physical memory.
|
|
BIO Rate
|
Buffered I/O rate. The rate at which I/O transfers occur between the
process buffer and an intermediate buffer from the system buffer pool.
|
|
PIO Rate
|
Paging I/O rate. The rate of read attempts necessary to satisfy page
faults (also known as page read I/O or the hard fault rate).
|
|
Open Files
|
Number of open files.
|
|
DIO Avail
|
Direct I/O limit remaining. The number of remaining direct I/O limit
operations available before the process reaches its quota. DIOLM quota
is the maximum number of direct I/O operations a process can have
outstanding at one time.
|
|
BIO Avail
|
Buffered I/O limit remaining. The number of remaining buffered I/O
operations available before the process reaches its quota. BIOLM
quota is the maximum number of buffered I/O operations a process can
have outstanding at one time.
|
|
BYTLM
|
The number of buffered I/O bytes available before the process reaches
its quota. BYTLM is the maximum number of bytes of nonpaged system
dynamic memory that a process can claim at one time.
|
|
Files
|
Open file limit remaining. The number of additional files the process
can open before reaching its quota. The FILLM quota is the maximum
number of files that can be opened simultaneously by the process,
including active network logical links.
|
When you double-click a PID on the lower part of the I/O Summaries
page, the Availability Manager displays an OpenVMS Single Process, where you
can click tabs to display specific data about one process. See
Section 3.3 for more details.
Click I/O Page/Swap Files on the I/O page View menu to select this
option. The
Availability Manager displays an OpenVMS I/O Page/Swap Files page. The top
pane displays the same information as that in the OpenVMS I/O Summaries
page (Figure 3-11). The bottom pane contains the I/O Page/Swap Files
Pane shown in Figure 3-12.
Figure 3-12 OpenVMS I/O Page/Swap Files Pane
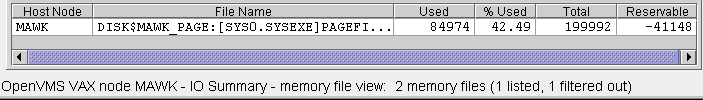
The I/O Page/Swap Files Pane displays the following data:
| Data |
Description |
|
Host Name
|
Name of the node on which the page or swap file resides.
|
|
File Name
|
Name of the page or swap file. For secondary page or swap files, the
file name is obtained by a special AST to the job controller on the
remote node. The Availability Manager makes one attempt to retrieve the file
name.
|
|
Used
|
Number of used blocks in the file.
|
|
% Used
|
Of the available blocks in each file, the percentage that has been used.
|
|
Total
|
Total number of blocks in the file.
|
|
Reservable
|
The number of reservable blocks in each page or swap file currently
installed. Reservable blocks are blocks that might be logially claimed
by a process for future physical allocation. A negative value indicates
that the file might be overcommitted. Although a negative value is not
an immediate concern, it indicates that the file might become
overcommitted if physical memory becomes scarce.
|
3.2.5 Disk Summaries
The Disk tab
allows you to display disk pages that contain data about availability,
count, and errors of disk devices on the system. OpenVMS disk data
displays differ from those for Windows nodes, as described in the
following sections.
On OpenVMS pages, the View menu lets you choose the following disk
summaries:
- Status Summary
- Volume Summary
Also, on the Disk Status Summary, you can double-click a device name to
display a Single Disk Summary page.
To display the default disk page, the OpenVMS Disk Status Summary
(Figure 3-13), click the Disk tab on the OpenVMS Node Summary page.
The Disk Status Summary page displays disk device data, including path,
volume name, status, and mount, transaction, error, and resource wait
counts.
Figure 3-13 OpenVMS Disk Status Summary
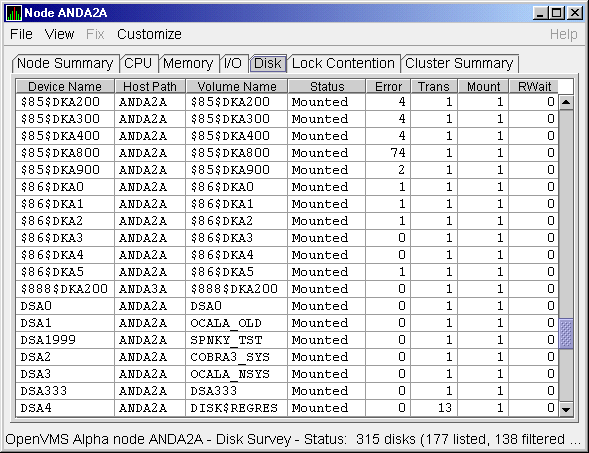
This summary displays the following data:
| Heading |
Description |
|
Device Name
|
Standard OpenVMS device name that indicates where the device is
located, as well as a controller or unit designation.
|
|
Host Path
|
Primary path (node) from which the device receives commands.
|
|
Volume Name
|
Name of the mounted media.
|
|
Status
|
One or more of the following disk status values:
|
Alloc
|
Disk is allocated to a specific user.
|
|
CluTran
|
Disk status is uncertain because of a cluster state transition in
progress.
|
|
Dismount
|
Disk in process of dismounting; may be waiting for a file to close.
|
|
Foreign
|
Disk is mounted with the /FOREIGN qualifier.
|
|
Invalid
|
Disk is in an invalid state (most likely Mount Verify Timeout).
|
|
MntVerify
|
Disk is waiting for a mount verification.
|
|
Mounted
|
Disk is logically mounted by a MOUNT command.
|
|
Offline
|
Disk is no longer physically mounted in device drive.
|
|
Online
|
Disk is physically mounted in device drive.
|
|
Shadow Set Member
|
Disk is a member of a shadow set.
|
|
Unavailable
|
Disk is set to unavailable.
|
|
Wrong Volume
|
Disk was mounted with the wrong volume name.
|
|
Wrtlck
|
Disk is mounted and write locked.
|
|
|
Error
|
Number of errors generated by the disk (a quick indicator of device
problems).
|
|
Trans
|
Number of in-progress file system operations for the disk.
|
|
Mount
|
Number of nodes that have the specified disk mounted.
|
|
Rwait
|
Indicator that a system I/O operation is stalled, usually during normal
recovery from a connection failure or during volume processing of
host-based shadowing.
|
3.2.5.2 OpenVMS Single Disk Summary
To collect single disk data and display the data on the Single Disk
Summary, double-click a device name on the Disk Status Summary.
Figure 3-14 is an example of a Single Disk Summary page. The display
interval of the data collected is 5 seconds.
Figure 3-14 OpenVMS Single Disk Summary Page
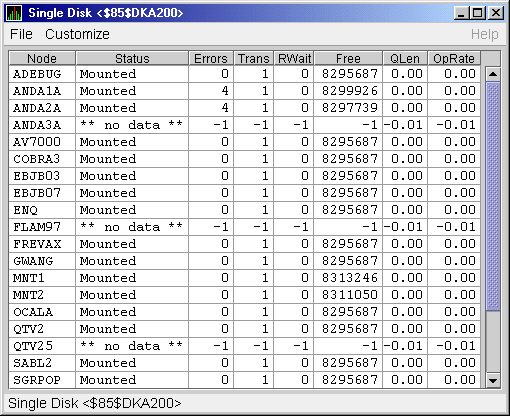
This summary displays the following data:
| Data |
Description |
|
Node
|
Name of the node.
|
|
Status
|
Status of the disk: mounted, online, offline, and so on.
|
|
Errors
|
Number of errors on the disk.
|
|
Trans
|
Number of in-progress file system operations on the disk (number of
open files on the volume).
|
|
Rwait
|
Indication of an I/O stalled on the disk.
|
|
Free
|
Number of free disk blocks on the volume.
|
|
QLen
|
Average number of operations in the I/O queue for the volume.
|
|
OpRate
|
Each node's contribution to the total operation rate (number of I/Os
per second) for the disk.
|
3.2.5.3 OpenVMS Disk Volume Summary
By using the View option on the Disk Status Summary page
(Figure 3-13), you can select the Volume Summary option to display
the OpenVMS Disk Volume Summary (Figure 3-15). This page displays
disk volume data, including path, volume name, disk block utilization,
queue length, and operation rate.
Figure 3-15 OpenVMS Disk Volume Summary Page
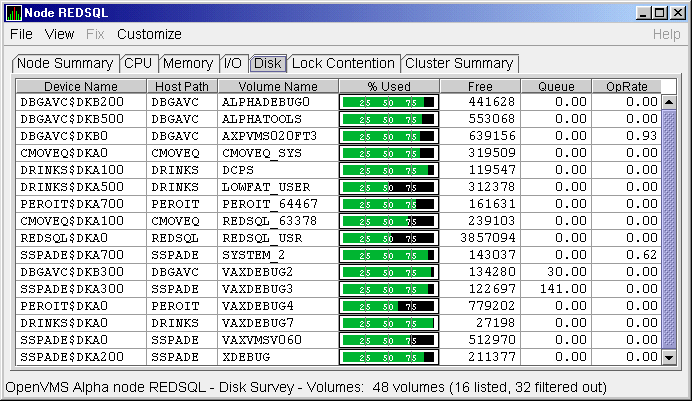
This summary displays the following data:
| Data |
Description |
|
Device Name
|
Standard OpenVMS device name that indicates where the device is
located, as well as a controller or unit designation.
|
|
Host Path
|
Primary path (node) from which the device receives commands.
|
|
Volume Name
|
Name of the mounted media.
|
|
% Used
|
Percentage of the number of volume blocks in use in relation to the
total volume blocks available.
|
|
Free
|
Number of blocks of volume space available for new data from the
perspective of the node that is mounted.
|
|
Queue
|
Average number of I/O operations pending for the volume (an indicator
of performance; less than 1.00 is optimal).
|
|
OpRate
|
Operation rate for the most recent sampling interval. The rate measures
the amount of activity on a volume. The optimal load is device specific.
|
Windows Logical and Physical Disk Summaries
On Windows nodes, the View menu lets you choose the following summaries:
- Logical Disk Summary
- Physical Disk Summary
3.2.5.4 Windows Logical Disk Summary
A logical disk is the user-definable set of partitions
under a drive letter. The Windows Logical Disk Summary displays logical
disk device data, including path, label, percentage used, free space,
and queue statistics.
To display the Logical Disk Summary page, follow these steps:
- Double-click a node name in the Node pane to display the Windows
Node Summary.
- Click the Disk tab on the Windows Node Summary.
The Availability Manager displays the Windows Logical Disk Summary page
(Figure 3-16).
Figure 3-16 Windows Logical Disk Summary Page
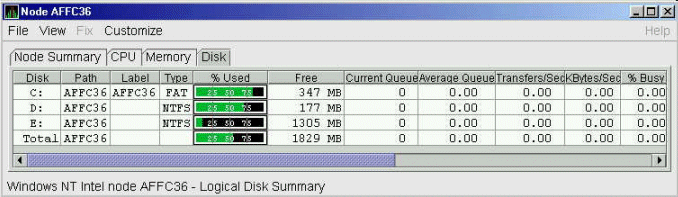
This summary displays the following data:
| Data |
Description |
|
Disk
|
Drive letter, for example,
c:, or
Total, which is the summation of statistics for all the disks.
|
|
Path
|
Primary path (node) from which the device receives commands.
|
|
Label
|
Identifying label of a volume.
|
|
Type
|
File system type; for example, FAT or NTFS.
|
|
% Used
|
Percentage of disk space used.
|
|
Free
|
Amount of free space available on the logical disk unit.
|
|
Current Queue
|
Number of requests outstanding on the disk at the time the performance
data is collected. It includes requests in progress at the time of data
collection.
|
|
Average Queue
|
Average number of both read and write requests that were queued for the
selected disk during the sample interval.
|
|
Transfers/Sec
|
Rate of read and write operations on the disk.
|
|
KBytes/Sec
|
Rate data is transferred to or from the disk during write or read
operations. The rate is displayed in kilobytes per second.
|
|
% Busy
|
Percentage of elapsed time that the selected disk drive is busy
servicing read and write requests.
|
|