Software > OpenVMS Systems > Documentation > 82final > 4538 HP OpenVMS Systems Documentation |
HP OpenVMS Debugger Manual
12.1.7 Controlling the Speed of DisplayTo examine events in the Memory Map as your application is executing, you can use the Heap Analyzer's push buttons to slow, pause, and otherwise affect the speed of the display. Figure 12-4 shows these push buttons on the Heap Analyzer window just after the Start button was pushed. The Slow and Pause push buttons allow you to slow or pause the display. The Step push button allows you to single-step through memory events. The Sync histogram (not shown) to the right of the Sync button indicates how far behind your application the Heap Analyzer is running. For performance reasons, the Heap Analyzer displays memory events a few seconds after their occurrence in your application. Figure 12-4 Heap Analyzer Control Panel 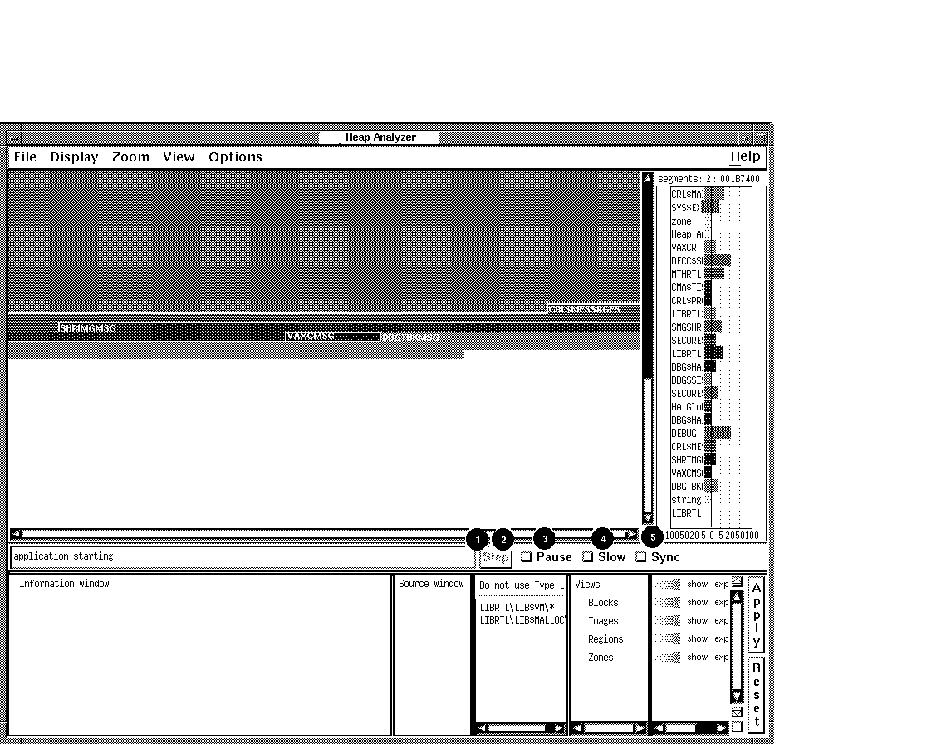
The Sync push button allows you to synchronize Heap Analyzer display and application execution, if this is important to you. Your application runs more slowly when you request synchronization. On OpenVMS Alpha systems, anything that uses system service interception, like the debugger or the Heap Analyzer, is unable to intercept system service call images activated by shared linkage. The image activator, therefore, avoids shared linkage for images linked or run with /DEBUG, and instead activates private image copies. This affects performance of applications under Heap Analyzer control, as images activated by shared linkage run faster. 12.2 Working with the Default DisplayThe following sections describe how to use the Heap Analyzer when memory problems are clearly visible in the default Memory Map display. Visible problems include allocations that are larger than you expect, that repeat numerous times, that increment at each allocation, and that could occur in a more efficient way. In such cases, your Heap Analyzer session consists of the following steps:
12.2.1 Memory Map DisplayDepending on the size of your application, you may wish to examine the Memory Map display as your application is running (by using the push buttons to slow, pause, or step through events) or after your application completes running (by using the Memory Map's vertical scroll bar to scroll back through the display). You can identify segments whose size or location are not what you expect by remembering that a segment's location in the Memory Map corresponds to its location in dynamic memory. Lower addresses in dynamic memory are represented in the upper left of the Memory Map display. Addresses increase to the right and wrap at each line of the display. 12.2.2 Options for Memory Map DisplayAs you examine the Memory Map, you may wish to select display options that allow you to see more clearly those parts of the display you are most interested in. The Display Menu allows you to control whether you see segment type names within the Memory Map display, whether the display automatically scrolls to show the most recent activity, and whether you can compress the display. The Zoom Menu allows you to control the degree of magnification with which you see segments in the Memory Map. Choosing the Far menu item, for example, shows an overview of memory. Choosing Extremely Close shows a more detailed view of memory. Figure 12-5 shows the display options that appear in the Display pull-down menu. The figure then lists all the display options available in the Memory Map. Figure 12-5 Heap Analyzer Display Menu 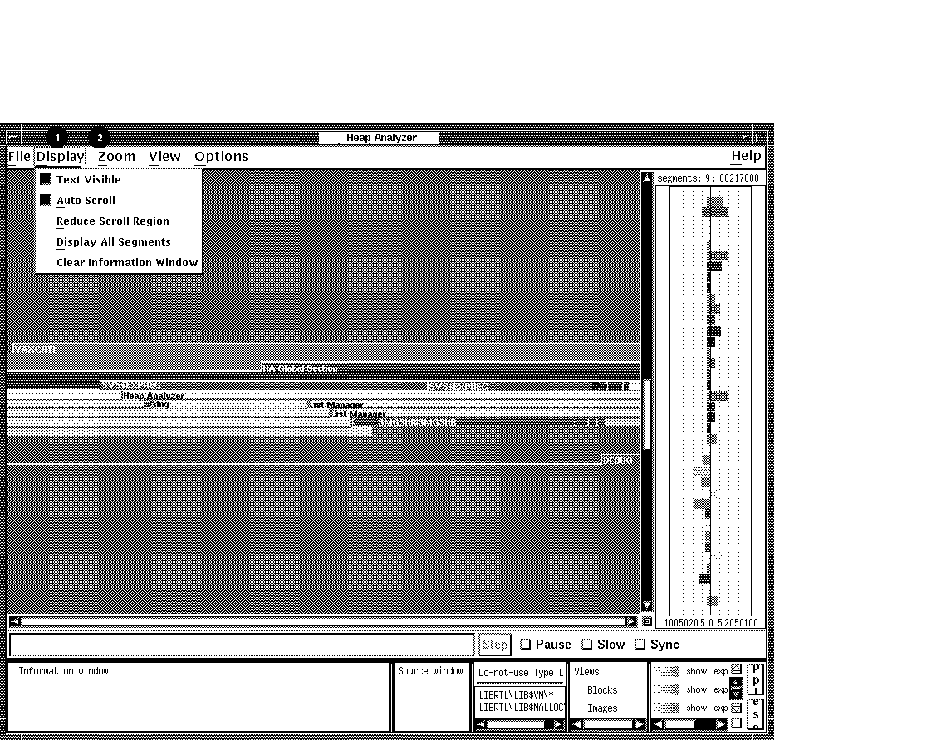
12.2.3 Options for Further InformationAs you examine the Memory Map display, you may find that you need more information on those segments that interest you. The Memory Map pop-up menu allows you to request segment, contents, address, and type definitions for an individual segment.A segment definition has the following form:
For example, the following segment definition describes the 15th segment in your Memory Map display, which is a segment of type LIBRTL:
A contents definition consists of a partial segment definition (a segment definition without a cursor-address) and an ASCII representation of the contents of segment addresses. For example:
An address definition takes the form of a statement describing user access to a stated address. For example:
A type definition takes the form of a statement summarizing the total number of segments and total number of bytes devoted to a segment type. For example:
Figure 12-6 shows the Memory Map context-sensitive pop-up menu. The figure then lists all the mouse and pop-up menu item choices available in the Memory Map. Figure 12-6 Heap Analyzer Memory Map Context-Sensitive Pop-Up Menu 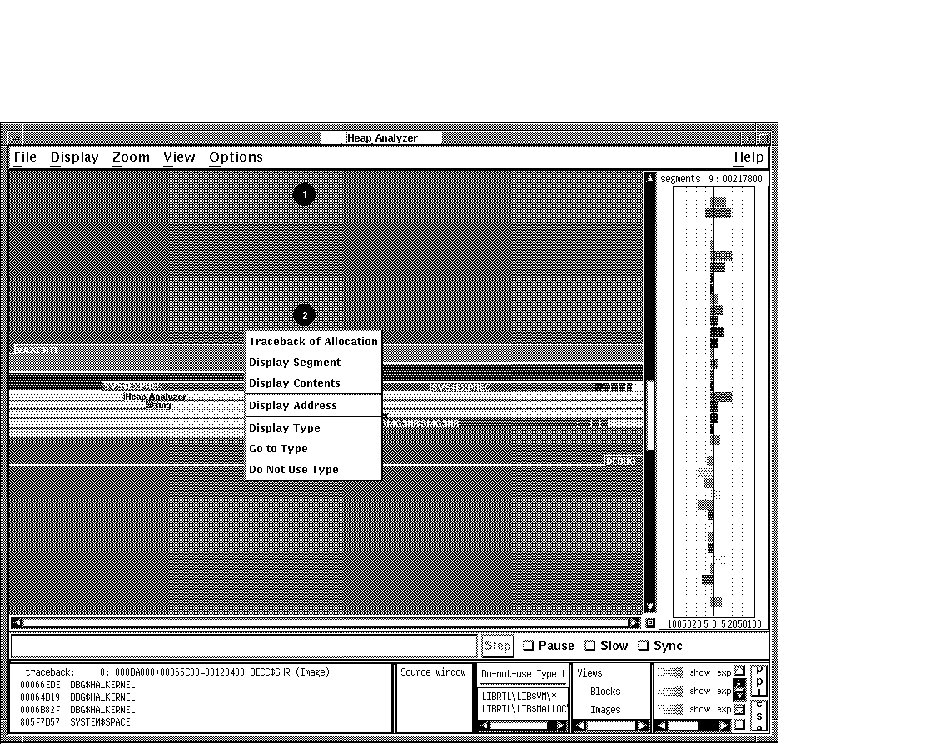
12.2.4 Requesting Traceback InformationAfter you identify an individual segment of interest, choose the Traceback of Allocation menu item in the Memory Map pop-up menu. Traceback information can help you understand why your segment was created. Viewing traceback is also a preliminary step to displaying application code.Traceback information consists of a partial segment definition (a segment definition without a cursor address) and the list of elements on the call stack at the moment your segment was created. The element naming convention is image name\module name\routine name \line number. For example:
12.2.5 Correlating Traceback Information with Source CodeWhen the traceback display appears, you identify the traceback entry most closely associated with the segment you are investigating. Most often, you can do this by comparing segment type names and traceback routine names. When you double click MB1 on this traceback entry, the source code associated with the entry appears (highlighted) in the Source window. You can then scroll through the source code display, identify problematic code, and decide how to correct it. If you cannot identify any problems in the displayed source code, return to the Information window and double click MB1 on the routine immediately above or below your previous choice. If you double click MB1 on a traceback entry, and 'Source Not Available' messages appear in the Source window, you may have forgotten to set a source directory at the beginning of your Heap Analyzer session. See Section 12.1.5 for information on setting a search directory. Figure 12-7 shows the source code that appears when you double click MB1 on the traceback entry highlighted in the Information window. The figure then lists all the mouse and menu item choices available for the Source and Information windows. Figure 12-7 Heap Analyzer Information and Source Windows 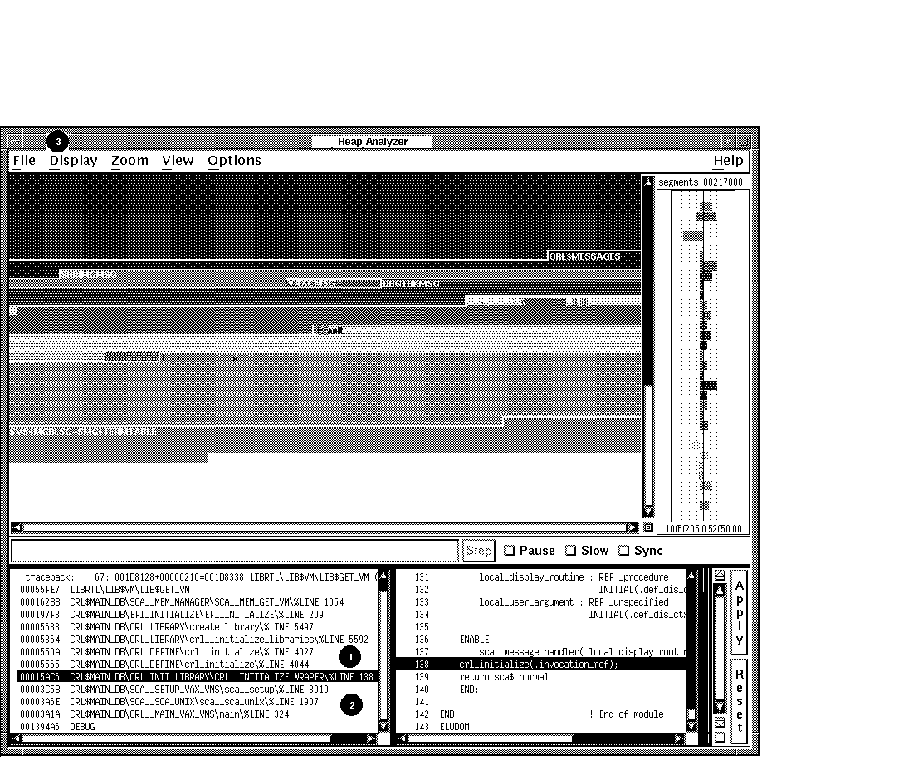
12.3 Adjusting Type Determination and DisplayThe following sections describe the steps to perform when the memory events represented in the default Memory Map are not clear; that is, you cannot tell whether a problem exists or not.This circumstance can occur when the segment type names chosen by the Heap Analyzer are too broad to be useful for your application, or when the Memory Map is so full that you cannot easily see the segment of interest. In such cases, you can choose one or both of the following strategies:
If, by adjusting the type determination or display, you then identify visible problems, you can resolve them in the same way you would if you were working with the default Memory Map display. (For more information, see Section 12.2.) 12.3.1 Options for Further InformationAs you examine the Memory Map, you may wish to see a summary of Memory Map activity in the Type Histogram. The Type Histogram, which is two histograms back-to-back, shows the percentage of total segments and the percentage of total bytes devoted to each segment type in the Memory Map. To see these graphical representations in numeric form, click MB1 on the segment type of interest. To see the total number of segments or total number of bytes, check the top of each histogram. Figure 12-8 shows the types listed in the Type Histogram. (This window has been resized so all types appear.) The figure then lists all the mouse and menu item choices available in the Type Histogram. Figure 12-8 Heap Analyzer Type Histogram 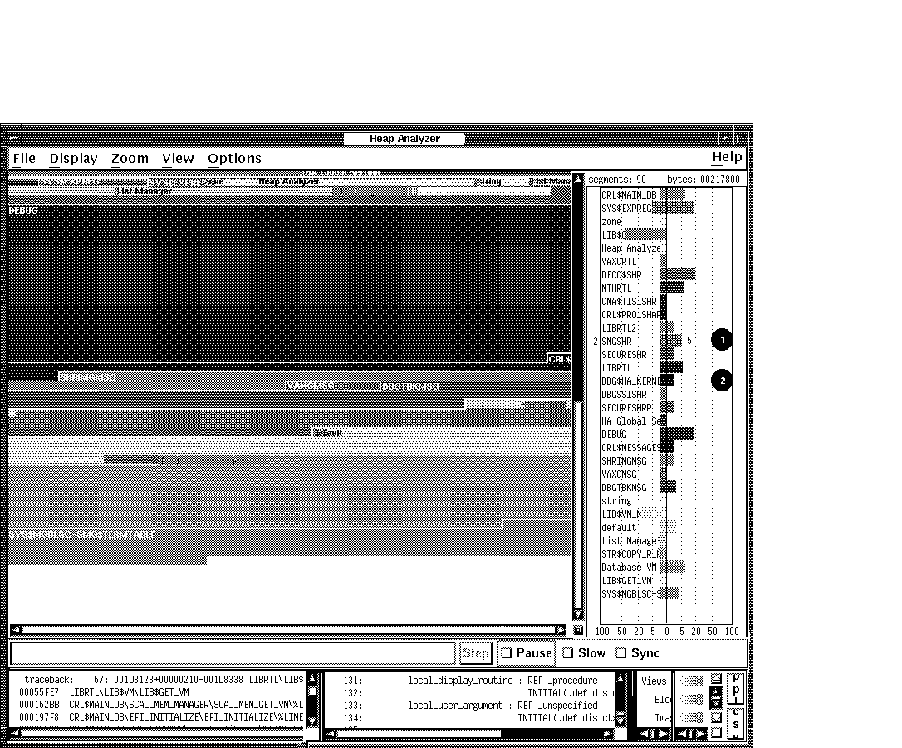
12.3.2 Altering Type DeterminationAs you examine the Memory Map, you may find that some segment type names are not meaningful to you. By adding these names to the Do-not-use Type List, you direct the Heap Analyzer to rename segments and, if necessary, regenerate the Memory Map display.By default, the analyzer assigns segment type names at the creation of a segment. In some cases, the analyzer assigns an element name (for example, LIBRTL). In most cases, however, the analyzer searches down the call stack to find a routine name that then serves as a segment type name. The analyzer chooses the first routine name on the call stack that is not prohibited by the Do-not-use Type List. If the first routine is prohibited, the analyzer examines the next routine down, and so on. This default behavior can cause the following Memory Map problems:
To add a segment type name to the Do-not-use Type List, you can select the Add to Do-not-use Type List pull-down menu item in the Options menu, or you can choose the Do Not Use Type pop-up menu item in the Memory Map, Type Histogram, or Views-and-Types Display. To delete a segment type from this list, choose the Use Type pop-up menu item in the Do-not-use Type List. To save the contents of a Do-not-use Type List, you can choose the Save Do-not-use Type List menu item in the Options menu. This saves the list for future Heap Analyzer sessions. The Restore Do-not-use Type List menu item removes recent additions to the list since the last time the list was saved. Figure 12-9 shows a LIBRTL\*\* entry in the Add to Do-not-use Type List dialog box you can choose from the Options menu. The figure then lists all the mouse and menu item choices available for the Do-not-Use Type List. Figure 12-9 Heap Analyzer Do-Not-Use Type List 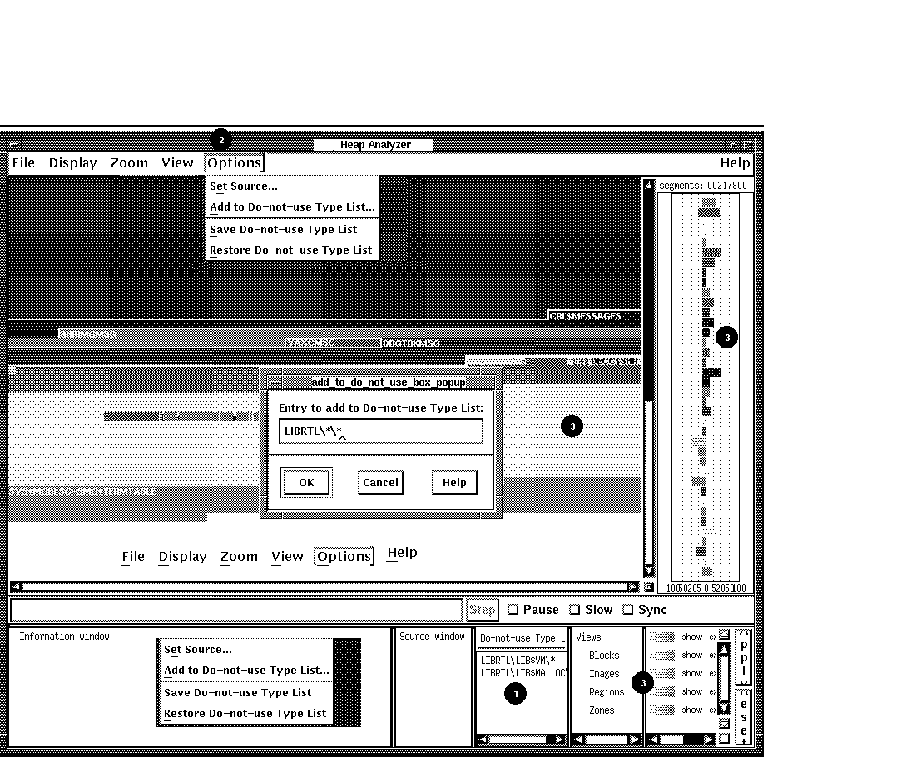
12.3.3 Altering the Views-and-Types DisplayAs you examine the Memory Map, you may find that you need to adjust the type display to focus more clearly on your area of interest. The Views-and-Types Display allows you to specify changes to multiple or individual segments of the same type.The Views-and-Types Display is actually two windows separated by a window sash. You can expand the left window to show all the known types in your application. The right window contains the display options (color, show status, expand status, and save status). 12.3.3.1 Selecting the Scope of Your ChangeThe Heap Analyzer receives information about segments from four OpenVMS memory managers that perform allocations and deallocations in memory space. Each memory manager has a slightly different view, or overall picture, of dynamic memory. Each memory manager recognizes a different set of segment types. This means that, within the Heap Analyzer, where views from the memory managers are layered on each other, a single memory location can be associated with one or more segment types. The left window of the Views-and-Types Display contains a hierarchy that reflects this integration:
To see the individual segment types recognized by each memory manager, expand the default display by double clicking MB1 on Blocks, Images, Regions, or Zones keywords. To collapse an individual listing, click MB3 on the keyword you previously selected. This hierarchy offers you the following choices in scope:
Figure 12-10 shows the Block hierarchy item that is highlighted when you click MB1 to choose all blocks. The figure then lists all the mouse and menu item choices available in the hierarchy side of the Views-and-Types Display. Figure 12-10 Heap Analyzer Views-and-Types Hierarchy 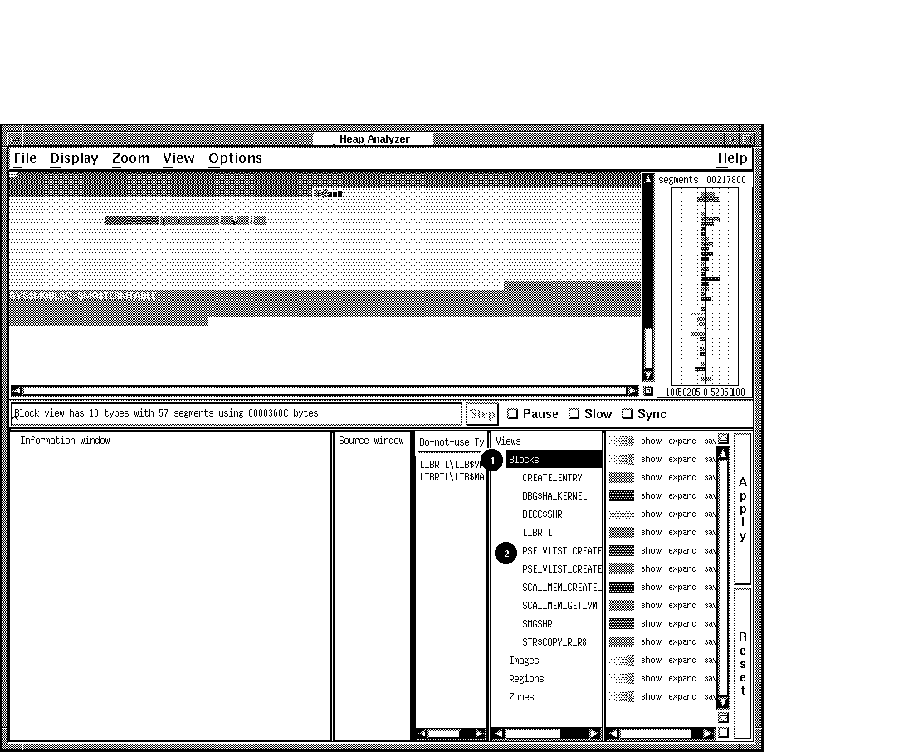
12.3.3.2 Choosing a Display OptionThe right window of the Views-and-Types Display shows the display options available, as follows:
To cancel a choice, click the Reset button, or choose the Reset menu item from the Show, Expand, or Save pop-up menus. Figure 12-11 shows the Show pop-up menu that appears when you click MB3 on the options side of the Views-and-Types Display (the scope of your change, Blocks, has been previously highlighted). The figure then lists the mouse and menu item choices available in the options side of the Views-and-Types Display. Figure 12-11 Heap Analyzer Views-and-Types Display Options 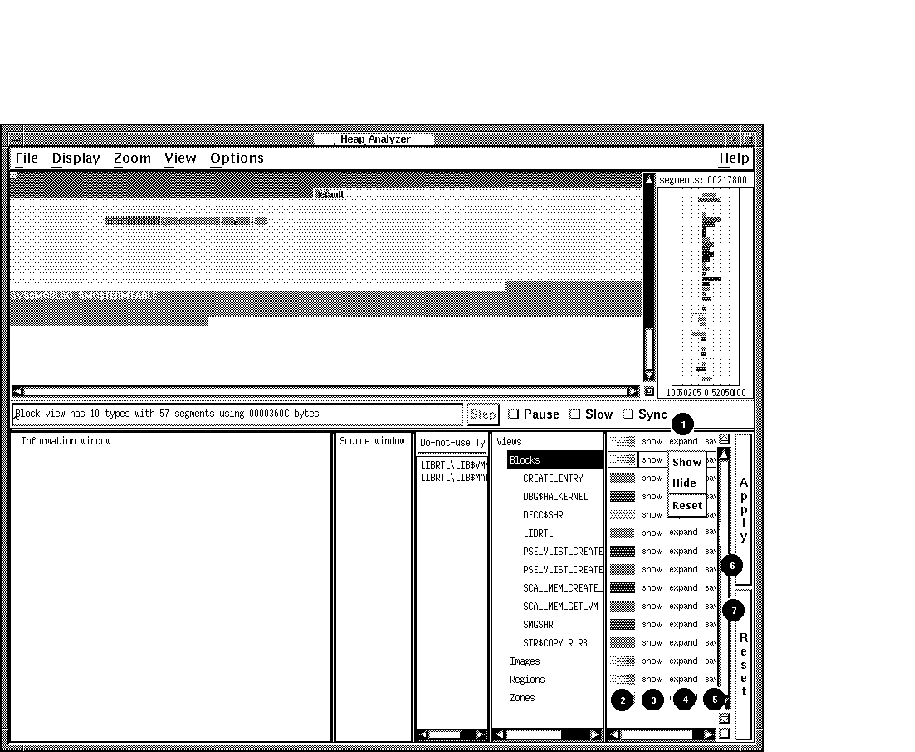
|