Software > OpenVMS Systems > Documentation > 82final > 4538 HP OpenVMS Systems Documentation |
HP OpenVMS Debugger Manual
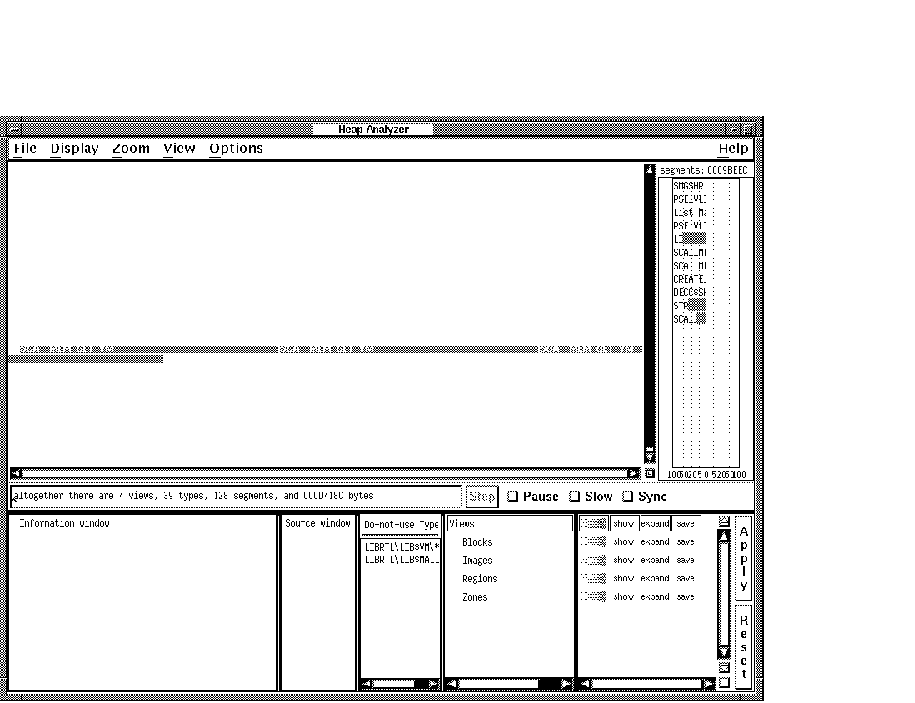
12.4 Exiting the Heap AnalyzerTo exit the Heap Analyzer, choose Exit from the File menu on the Heap Analyzer screen. 12.5 Sample SessionThis section contains an example that shows how to combine information from Heap Analyzer windows and menus to locate a particular memory leak in your application. The example assumes that you have invoked the Heap Analyzer and run your application. As you scroll back through the Memory Map display, you focus your attention on segments that appear when your application calls for an interactive command. 12.5.1 Isolating Display of Interactive CommandYou suspect that the leak occurs when you enter an interactive SHOW UNITS command, so your first step is to clear the Memory Map and reenter the command. To clear the Memory Map and reenter the command:
The memory space allocated to each SCA__MEM_GET_VM segment is slightly larger with each SHOW UNITS command (see Figure 12-12). This growth in what should be a same-size allocation indicates a memory leak. Figure 12-12 Incrementing Memory Allocation Indicates a Memory Leak 
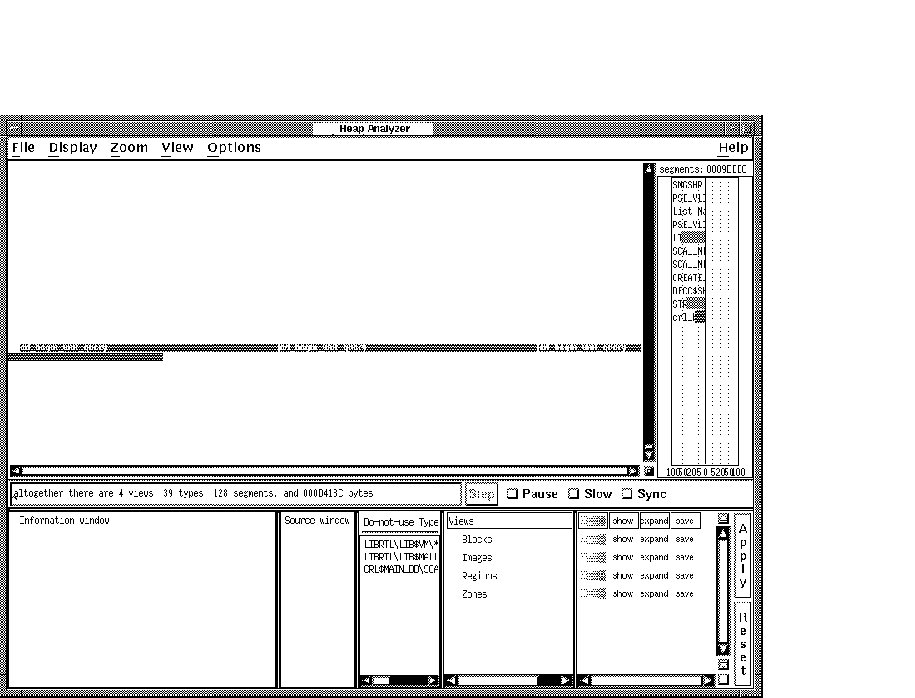
12.5.2 Adjusting Type DeterminationThe Heap Analyzer labels the segment type associated with your segments as SCA__MEM_GET_VM. This is a fairly low-level memory management routine that many segments might share. Your next step is to redefine the segment type to a more meaningful level of abstraction, perhaps one corresponding to the name of an application routine. To redefine the segment type:
Figure 12-13 The Do-Not-Use Type Menu Item Redefines Segment Type 
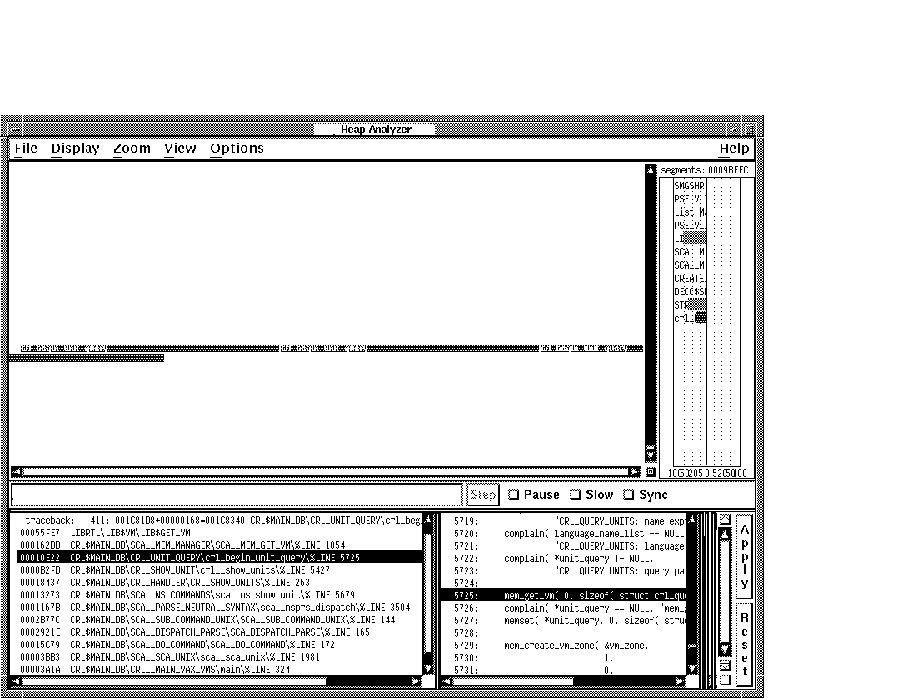
12.5.3 Requesting Traceback InformationAfter you determine the level of abstraction at which you want to view your segment, the next step is to examine the state of the call stack when the segment was allocated. Reviewing the traceback associated with a segment can reveal when and why it was created, and why a memory problem is occurring. To request traceback information:
12.5.4 Correlating Traceback with Source CodeThe traceback for your segment indicates that the crl_begin_unit_query routine sets up the environment for the SHOW UNITS command. To examine this event further, you can request to see the source code associated with it. To request source code, double click MB1 on the traceback line that refers to crl_begin_unit_query. Source code appears in the Source window. The routine call that placed crl_begin_unit_query on the call stack is highlighted (see Figure 12-14). Figure 12-14 The Click on Traceback Entry Shows Associated Source Code 
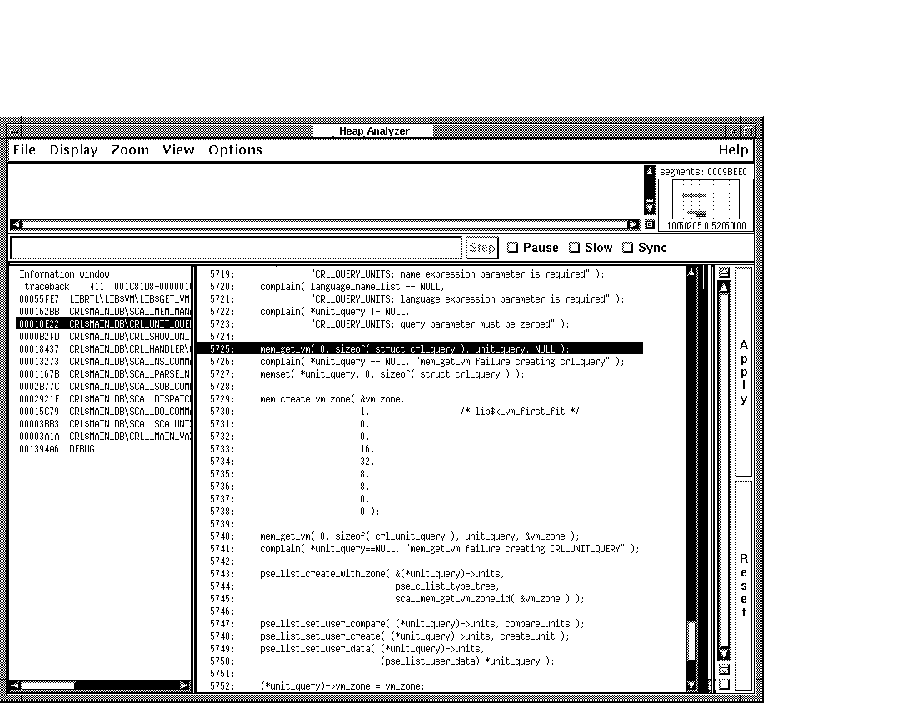
12.5.5 Locating an Allocation Error in Source CodeAfter you connect a traceback entry to a routine in your application source code, you can enlarge the Source window and search for allocation errors in that source code location.For example, the highlighted line 5725 in Figure 12-15 makes an allocation to unit_query. This allocation is not deallocated before line 5740, where an additional allocation occurs. This coding error is the cause of your memory leak. Figure 12-15 Review of Source Code Shows Double Allocation 
Chapter 13
|
! ***** Debugger Command Procedure BREAK7.COM ***** SET BREAK/AFTER:3 %LINE 120 DO (EXAMINE K,N,J,X(K); GO) SET BREAK/AFTER:3 %LINE 160 DO (EXAMINE K,N,J,X(K),S; GO) SET BREAK %LINE 90 |
When you execute this command procedure with the execute procedure (@) command, the commands listed in the procedure are executed in the order they appear.
The rules for entering commands in command procedures are listed in the debugger's online help (type HELP Command_Format).
You can pass parameters to a command procedure. See Section 13.1.2 for conventions on passing parameters.
You can enter the execute procedure (@) command like any other debugger command: directly from the terminal, from within another command procedure, from within a DO clause in a command such as SET BREAK, or from within a DO clause in a screen display definition.
If you do not supply a full file specification with the execute procedure (@) command, the debugger assumes SYS$DISK:[]DEBUG.COM as the default file specification for command procedures. For example, enter the following command line to execute command procedure BREAK7.COM, located in your current default directory:
DBG> @BREAK7 |
The SET ATSIGN command enables you to change any or all fields of the default file specification, SYS$DISK:[]DEBUG.COM. The SHOW ATSIGN command identifies the default file specification for command procedures.
By default, commands read from a command procedure are not echoed. If you enter the SET OUTPUT VERIFY command, all commands read from a command procedure are echoed on the current output device, as specified by DBG$OUTPUT (the default output device is SYS$OUTPUT). Use the SHOW OUTPUT command to determine whether commands read from a command procedure are echoed or not.
If the execution of a command in a command procedure results in a diagnostic of severity warning or greater, the command is aborted but execution of the command procedure continues at the next command line.
As with DCL command procedures, you can pass parameters to debugger command procedures. However, the technique is different in several respects.
Subject to the conventions described here, you can pass as many parameters as you want to a debugger command procedure. The parameters can be address expressions, commands, or value expressions in the current language. You must surround command strings in quotation marks ("), and you must separate parameters by commas (,).
A debugger command procedure to which you pass parameters must contain a DECLARE command line that binds each actual (passed) parameter to a formal parameter (a symbol) declared within the command procedure.
The DECLARE command is valid only within a command procedure. Its syntax is as follows:
DECLARE p-name:p-kind[, p-name:p-kind[, ...]] |
Each p-name:p-kind pair associates a formal parameter (p-name) with a parameter kind (p-kind). The valid p-kind keywords are as follows:
| ADDRESS | Causes the actual parameter to be interpreted as an address expression |
| COMMAND | Causes the actual parameter to be interpreted as a command |
| VALUE | Causes the actual parameter to be interpreted as a value expression in the current language |
The following example shows what happens when a parameter is passed to a command procedure. The command DECLARE DBG:ADDRESS, within command procedure EXAM.COM, declares the formal parameter DBG. The actual parameter passed to EXAM.COM is interpreted as an address expression. The command EXAMINE DBG displays the value of that address expression. The command SET OUTPUT VERIFY causes the commands to echo when they are read by the debugger.
! ***** Debugger Command Procedure EXAM.COM ***** SET OUTPUT VERIFY DECLARE DBG:ADDRESS EXAMINE DBG |
The next command line executes EXAM.COM by passing the actual parameter ARR24. Within EXAM.COM, ARR24 is interpreted as an address expression (an array variable, in this case).
DBG> @EXAM ARR24
%DEBUG-I-VERIFYIC, entering command procedure EXAM
 DECLARE DBG:ADDRESS
 EXAMINE DBG
PROG_8\ARR24
    (1):        Mark A. Hopper
    (2):        Rudy B. Hopper
    (3):        Tim B. Hopper
    (4):        Don C. Hopper
    (5):        Mary D. Hopper
    (6):        Jeff D. Hopper
    (7):        Nancy G. Hopper
    (8):        Barbara H. Hopper
    (9):        Lon H. Hopper
   (10):        Dave H. Hopper
   (11):        Andy J. Hopper
   (12):        Will K. Hopper
   (13):        Art L. Hopper
   (14):        Jack M. Hopper
   (15):        Karen M. Hopper
   (16):        Tracy M. Hopper
   (17):        Wanfang M. Hopper
   (18):        Jeff N. Hopper
   (19):        Nancy O. Hopper
   (20):        Mike R. Hopper
   (21):        Rick T. Hopper
   (22):        Dave W. Hopper
   (23):        Jim W. Hopper
   (24):        Robert Z. Hopper
%DEBUG-I-VERIFYIC, exiting command procedure EXAM
DBG>
|
Each p-name:p-kind pair specified by a DECLARE command binds one parameter. For example, if you want to pass five parameters to a command procedure, you need five corresponding p-name:p-kind pairs. The pairs are always processed in the order in which you specify them.
For example, the next command procedure, EXAM_GO.COM, accepts two parameters: an address expression (L) and a command string (M). The address expression is then examined and the command is executed:
! ***** Debugger Command Procedure EXAM_GO.COM ***** DECLARE L:ADDRESS, M:COMMAND EXAMINE L; M |
The following example shows how you can execute EXAM_GO.COM by passing a variable X to be examined and a command @DUMP.COM to be executed:
DBG> @EXAM_GO X, "@DUMP" |
The %PARCNT built-in symbol, which can be used only within a command procedure, enables you to pass a variable number of parameters to a command procedure. The value of %PARCNT is the number of actual parameters passed to the command procedure.
The %PARCNT built-in symbol is shown in the following example. The command procedure, VAR.DBG, contains the following lines:
! ***** Debugger Command Procedure VAR.DBG ***** SET OUTPUT VERIFY ! Display the number of parameters passed: EVALUATE %PARCNT ! Loop as needed to bind all passed parameters and obtain their values: FOR I = 1 TO %PARCNT DO (DECLARE X:VALUE; EVALUATE X) |
The following command line executes VAR.DBG, passing the parameters 12, 37, and 45:
DBG> @VAR.DBG 12,37,45 %DEBUG-I-VERIFYIC, entering command procedure VAR.DBG ! Display the number of parameters passed: EVALUATE %PARCNT 3 ! Loop as needed to bind all passed parameters ! and get their values: FOR I = 1 TO %PARCNT DO (DECLARE X:VALUE; EVALUATE X) 12 37 45 %DEBUG-I-VERIFYIC, exiting command procedure VAR.DBG DBG> |
When VAR.DBG is executed, %PARCNT has the value 3. Therefore, the FOR loop within VAR.DBG is repeated 3 times. The FOR loop causes the DECLARE command to bind each of the three actual parameters (starting with 12) to a new declaration of X. Each actual parameter is interpreted as a value expression in the current language, and the EVALUATE X command displays that value.
A debugger initialization file is a command procedure, assigned the logical name DBG$INIT, that the debugger automatically executes at debugger startup. Every time you start the debugger, the commands contained in the file are automatically executed.
An initialization file contains any command lines you might always enter at the start of a debugging session to either tailor your debugging environment or control the execution of your program in a predetermined way from run to run.
For example, you might have a file DEBUG_START4.COM containing the following commands:
! ***** Debugger Initialization File DEBUG_START4.COM ***** ! Log debugging session into default log file (SYS$DISK:[]DEBUG.LOG) SET OUTPUT LOG ! ! Echo commands as they are read from command procedures: SET OUTPUT VERIFY ! ! If source files are not in current default directory, use [SMITH.SHARE] SET SOURCE [],[SMITH.SHARE] ! ! Invoke screen mode: SET MODE SCREEN ! ! Define the symbol SB as the SET BREAK command: DEFINE/COMMAND SB = "SET BREAK" ! ! Assign the SHOW MODULE * command to KP7: DEFINE/KEY/TERMINATE KP7 "SHOW MODULE *" |
To make this file a debugger initialization file, use the DCL command DEFINE. For example:
$ DEFINE DBG$INIT WORK:[JONES.DBGCOMFILES]DEBUG_START4.COM |
A debugger log file maintains a history of a debugging session. During the debugging session, each command entered and the resulting debugger output are stored in the file. The following is an example of a debugger log file:
SHOW OUTPUT
!noverify, terminal, noscreen_log, logging to DSK2:[JONES.P7]DEBUG.LOG;1
SET STEP NOSOURCE
SET TRACE %LINE 30
SET BREAK %LINE 60
SHOW TRACE
!tracepoint at PROG4\%LINE 30
GO
!trace at PROG4\%LINE 30
!break at PROG4\%LINE 60
     .
     .
     .
|
The DBG> prompt is not recorded, and the debugger output is commented out with exclamation points so the file can be used as a debugger command procedure without modification. Thus, if a lengthy debugging session is interrupted, you can execute the log file as you would any other debugger command procedure. Executing the log file restores the debugging session to the point at which it was previously terminated.
To create a debugger log file, use the SET OUTPUT LOG command. By default, the debugger writes the log to SYS$DISK:[]DEBUG.LOG. To name a debugger log file, use the SET LOG command. You can override any field of the default file specification. For example, after you enter the following commands, the debugger logs the session to the file [JONES.WORK2]MONITOR.LOG:
DBG> SET LOG [JONES.WORK2]MONITOR DBG> SET OUTPUT LOG |
You might want to enter the SET OUTPUT LOG command in your debugger initialization file (see Section 13.2).
The SHOW LOG command reports whether the debugger is writing to a log file and identifies the current log file. The SHOW OUTPUT command identifies all current output options.
If you are debugging in screen mode, the SET OUTPUT SCREEN_LOG command enables you to log the screen contents as the screen is updated. To use this command, you must already be logging your debugging session---that is, the SET OUTPUT SCREEN_LOG command is valid only after you enter the SET OUTPUT LOG command. Using SET OUTPUT SCREEN_LOG is not desirable for a long debugging session, because storing screen information in this manner results in a large log file. For other techniques on saving screen-mode information, see the SAVE and EXTRACT command descriptions.
To use a log file as a command procedure, first enter the SET OUTPUT VERIFY command so that debugger commands are echoed as they are read.
The DEFINE command enables you both to create a symbol for a lengthy or often-repeated command sequence or address expression and to store the value of a language expression in a symbol.
You specify the kind of symbol you want to define by the command qualifier you use with the DEFINE command (/COMMAND, /ADDRESS, or /VALUE). The default qualifier is /ADDRESS. If you plan to enter several DEFINE commands with the same qualifier, you can first use the SET DEFINE command to establish a new default qualifier (for example, SET DEFINE COMMAND makes the DEFINE command behave like DEFINE/COMMAND). The SHOW DEFINE command identifies the default qualifier currently in effect.
Use the SHOW SYMBOL/DEFINED command to identify symbols you have defined with the DEFINE command. Note that the SHOW SYMBOL command without the /DEFINED qualifier identifies only the symbols that are defined in your program, such as the names of routines and variables.
Use the DELETE command to delete symbol definitions created with the DEFINE command.
When defining a symbol within a command procedure, use the /LOCAL qualifier to confine the symbol definition to that command procedure.
Use the DEFINE/COMMAND command to equate one or more command strings to a shorter symbol. The basic syntax is shown in the following example:
DBG> DEFINE/COMMAND SB = "SET BREAK" DBG> SB PARSER |
In the example, the DEFINE/COMMAND command equates the symbol SB to the string SET BREAK (note the use of the quotation marks to delimit the command string). When the command line SB PARSER is executed, the debugger substitutes the string SET BREAK for the symbol SB and then executes the SET BREAK command.
In the following example, the DEFINE/COMMAND command equates the symbol BT to the string consisting of the SHOW BREAK command followed by the SHOW TRACE command (use semicolons to separate multiple command strings):
DBG> DEFINE/COMMAND BT = "SHOW BREAK;SHOW TRACE" |
The SHOW SYMBOL/DEFINED command identifies the symbol BT as follows:
DBG> SHOW SYM/DEFINED BT
defined BT
    bound to: "SHOW BREAK;SHOW TRACE"
    was defined /command
DBG>
|
To define complex commands, you might need to use command procedures with parameters (see Section 13.1.2 for information about passing parameters to command procedures). For example:
DBG> DEFINE/COMMAND DUMP = "@DUMP_PROG2.COM" |
Use the DEFINE/ADDRESS command to equate an address expression to a symbol. /ADDRESS is the default qualifier for the DEFINE command, but it is used in the following examples for emphasis.
In the following example, the symbol B1 is equated to the address of line 378; the SET BREAK B1 command then sets a breakpoint on line 378:
DBG> DEFINE/ADDRESS B1 = %LINE 378 DBG> SET BREAK B1 |
The DEFINE/ADDRESS command is useful when you need to specify a long path name repeatedly to reference the name of a variable or routine that is defined multiple times. In the next example, the symbol UX is equated to the path name SCREEN_IO\UPDATE\X; the abbreviated command line EXAMINE UX can then be used to obtain the value of X in routine UPDATE of module SCREEN_IO:
DBG> DEFINE UX = SCREEN_IO\UPDATE\X DBG> EXAMINE UX |
| Previous | Next | Contents | Index |