Software > OpenVMS Systems > Documentation > 83final > 6552 HP OpenVMS Systems Documentation |
HP OpenVMS Availability Manager User's Guide
1.3.3.1 Understanding OpenVMS Security TripletsA security triplet determines which nodes can access system data from an OpenVMS Data Collector node. The AMDS$DRIVER_ACCESS.DAT file on OpenVMS Data Collector nodes lists security triplets. On OpenVMS Data Collector nodes, the AMDS$AM_CONFIG logical translates to the location of the default security file, AMDS$DRIVER_ACCESS.DAT. This file is installed on all OpenVMS Data Collector nodes. A security triplet is a three-part record whose fields are separated by backslashes (\). A triplet consists of the following fields:
The exclamation point (!) is a comment delimiter; any characters to the right of the comment delimiter are ignored. All Data Collector nodes in group FINANCE have the following AMDS$DRIVER_ACCESS.DAT file:
1.3.3.2 How to Change a Security Triplet
On each Data Collector node on which you want to change security, you must edit the AMDS$DRIVER_ACCESS.DAT file. The data in the AMDS$DRIVER_ACCESS.DAT file is set up as follows:
Use a backslash character (\) to separate the three fields. To edit the AMDS$DRIVER_ACCESS.DAT file, follow these steps:
The following security triplets are all valid; an explanation follows the exclamation point (!).
OpenVMS Data Collector nodes accept more than one password. Therefore, you might have several security triplets in an AMDS$DRIVER_ACCESS.DAT file for one Data Collector node. For example:
In this example, Data Analyzer nodes with the passwords 1DECAMDS and KOINECLS are able to see the Data Collector data, but only the Data Analyzer node with the KOINEFIX password is able to write or change information, including performing fixes, on the Data Collector node. The Data Analyzer node with the AVAILMAN password is able to perform switched LAN fixes and other control functions. You can choose to set up your AMDS$DRIVER_ACCESS.DAT file to allow anyone on the local LAN to read from your system, but to allow only certain nodes to write or change process or device characteristics on your system. For example:
In this example, any Data Analyzer node using the 1DECAMDS password can read data from your system. However, only the Data Analyzer node with the hardware address 08-00-2B-03-23-CD and the password 2NODEFIX can perform fixes and other control functions.
1.3.4 Processing Security TripletsThe Availability Manager performs these steps when using security triplets to ensure security among Data Analyzer and Data Collector nodes:
Table 1-1 describes how the Data Collector node interprets a security triplet match.
The logical names shown in Table 1-2 control the sending of messages to OPCOM and are defined in the AMDS$LOGICALS.COM file on the Data Collector node.
To put these changes into effect, restart the Data Collector with the following command:
1.4 How Does the Availability Manager Identify Performance Problems?When the Availability Manager detects problems on your system, it uses a combination of methods to bring these problems to the attention of the system manager. It examines both the types of data collected and how often it is collected and analyzed to determine problem areas to be signaled. Performance problems are also posted in the Event pane, which is in the lower portion of the System Overview window (Figure 1-1). The following topics are related to the method of detecting problems and posting events:
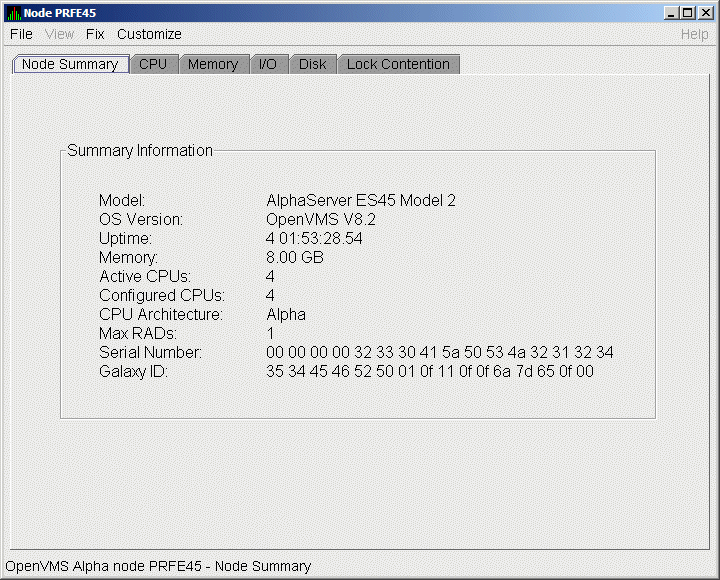
1.4.1 Collecting and Analyzing DataThis section explains how the Availability Manager collects and analyzes data. It also defines related terms. 1.4.1.1 Events and Data CollectionThe data that the Availability Manager collects is grouped into data collections. These collections are composed of related data---for example, CPU data, memory data, and so on. Usually, the data items on the tabs (like the ones displayed in Figure 1-5) consist of one data collection. Figure 1-5 Sample Node Summary 
An event is a problem or potential problem associated with resource availability. Events are associated with various data collections. For example, the CPU Process data collection shown in Figure 1-6 is associated with the PRCCUR, PRCMWT, and PRCPWT events. (Appendix B describes events, and Appendix C describes the events that each type of data collection can signal.) For these events to be signalled, you must enable the CPU Process data collection, as described in Section 1.4.1.2. Users can also customize criteria for events, which is described in Section 1.4.2. 1.4.1.2 Types of Data CollectionYou can use the Availability Manager to collect data either as a background activity or as a foreground activity. Note that for either type of data collection, if you collect data for a specific node, only that node is affected. If you collect data for a group, all the nodes in that group are affected.
1.4.1.3 Data Collection IntervalsData collection intervals, which are displayed on the Data Collection customization page (Figure 1-6), specify the frequency of data collection. Table 1-3 describes these intervals.
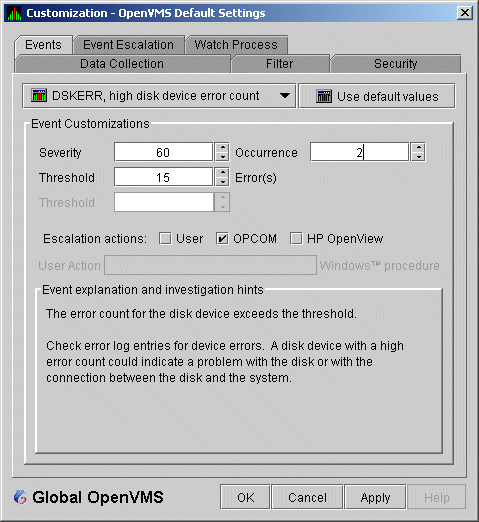
1.4.2 Posting EventsThe Availability Manager evaluates each data collection for events. The Availability Manager posts events when data values in a data collection meet or exceed user-defined thresholds and occurrences. Values for thresholds and occurrences are displayed on Event Customization pages similar to the one shown in Figure 1-7. Thresholds and occurrences are described in the next section. Figure 1-7 Sample Event Customization 
1.4.2.1 Thresholds and OccurrencesThresholds and occurrences are criteria that the Availability Manager uses for posting events. A threshold is a value against which data in a data collection is compared. An occurrence is a value that represents the number of consecutive data collections that meet or exceed the threshold. Both thresholds and occurrences are customizable values that you can adjust according to the needs of your system. For details about how to change the values for thresholds and occurrences, see Chapter 7.
Relationship Between Thresholds and Occurrences
For a particular event, when the data collected meet or exceed the threshold, the data collection enters a threshold-exceeded state. When the number of consecutive data collections to enter this state meets or exceeds the value in the Occurrence box (see Figure 1-7), the Availability Manager displays (posts) the event in the Event pane. A closer look at Figure 1-7 shows the relationship between thresholds and occurrences. For the DSKERR, high disk device error count event, a threshold of 15 errors has been set. A value of 2 in the Occurrence box indicates that the number of errors during 2 consecutive data collections must meet or exceed the threshold of 15 for the DSKERR event to be posted.
|