 |
HP OpenVMS Availability Manager User's Guide
Order Number:
BA554-90001
July 2006
This guide explains how to use HP Availability Manager software to
detect and correct system availability problems.
Revision/Update Information:
This guide supersedes the HP OpenVMS Availability Manager User's Guide, Version 2.5.
Operating System:
Data Analyzer:
Windows 2000 SP 4 or higher;
Windows XP SP 2;
OpenVMS Alpha Versions 8.2 and 8.3;
OpenVMS I64 Versions 8.2-1 and 8.3
Data Collector:
OpenVMS VAX Version 6.2 and 7.3;
OpenVMS Alpha Versions 8.2 and 8.3;
OpenVMS I64 Versions 8.2-1 and 8.3
Software Version:
HP Availability Manager Version 2.6
Hewlett-Packard Company Palo Alto, California
© 2006 Hewlett-Packard Development Company, L.P.
Confidential computer software. Valid license from HP required for
possession, use or copying. Consistent with FAR 12.211 and 12.212,
Commercial Computer Software, Computer Software Documentation, and
Technical Data for Commercial Items are licensed to the U.S. Government
under vendor's standard commercial license.
The information contained herein is subject to change without notice.
The only warranties for HP products and services are set forth in the
express warranty statements accompanying such products and services.
Nothing herein should be construed as constituting an additional
warranty. HP shall not be liable for technical or editorial errors or
omissions contained herein.
Intel and Itanium are trademarks or registered trademarks of Intel
Corporation or its subsidiaries in the United States and other
countries.
Microsoft and Windows are U.S. registered trademarks of Microsoft
Corporation.
Javatm is a US trademark of Sun Microsystems, Inc.
Printed in the US
ZK6552
Preface
Intended Audience
This guide is intended for system managers who install and use HP
Availability Manager software. It is assumed that the system managers
who use this product are familiar with Microsoft Windows terms and
functions.
Note
The term Windows as it is used in this manual refers
to either Windows 2000 or Windows XP but not to any other
Windows product.
|
Document Structure
This guide contains the following chapters and appendixes:
- Chapter 1 provides an overview of Availability Manager software,
including security features.
- Chapter 2 tells how to start the Availability Manager, use the
main System Overview window, select a group of nodes and individual
nodes, and use online help.
- Chapter 3 tells how to select nodes and display node data; it
also explains what node data is.
- Chapter 4 tells how to display OpenVMS Cluster summary and
detailed data; it also explains what cluster data is.
- Chapter 5 tells how to display and interpret events.
- Chapter 6 tells how to take a variety of corrective actions,
called fixes, to improve system availability.
- Chapter 7 describes the tasks you can perform to filter, select,
and customize the display of data and events.
- Appendix A contains a table of CPU process states that are
referred to in Section 3.2.2.4 and in Section 3.3.1.
- Appendix B contains a table of OpenVMS and Windows events that
can be displayed in the Event pane discussed in Chapter 5.
- Appendix C describes the events that can be signaled for each
type of OpenVMS data that is collected.
Related Documents
The following manuals provide additional information:
- HP OpenVMS System Manager's Manual describes tasks for managing an OpenVMS system. It
also describes installing a product with the POLYCENTER Software
Installation utility.
- HP OpenVMS System Management Utilities Reference Manual describes utilities you can use to manage an OpenVMS
system.
- HP OpenVMS Programming Concepts Manual explains OpenVMS lock management concepts.
For additional information about HP OpenVMS products and services,
visit the following World Wide Web address:
http://www.hp.com/go/openvms
|
Reader's Comments
HP welcomes your comments on this manual. Please send comments to
either of the following addresses:
|
Internet
|
openvmsdoc@hp.com
|
|
Postal Mail
|
Hewlett-Packard Company
OSSG Documentation Group, ZKO3-4/U08
110 Spit Brook Rd.
Nashua, NH 03062-2698
|
How to Order Additional Documentation
For information about how to order additional documentation, visit the
following World Wide Web address:
http://www.hp.com/go/openvms/doc/order
|
Conventions
The following conventions are used in this guide:
|
Ctrl/
x
|
A sequence such as Ctrl/
x indicates that you must hold down the key labeled Ctrl while
you press another key or a pointing device button.
|
|
PF1
x
|
A sequence such as PF1
x indicates that you must first press and release the key
labeled PF1 and then press and release another key or a pointing device
button.
|
|
[Return]
|
In examples, a key name enclosed in a box indicates that you press a
key on the keyboard. (In text, a key name is not enclosed in a box.)
In the HTML version of this document, this convention appears as
brackets, rather than a box.
|
|
...
|
A horizontal ellipsis in examples indicates one of the following
possibilities:
- Additional optional arguments in a statement have been omitted.
- The preceding item or items can be repeated one or more times.
- Additional parameters, values, or other information can be entered.
|
.
.
.
|
A vertical ellipsis indicates the omission of items from a code example
or command format; the items are omitted because they are not important
to the topic being discussed.
|
|
( )
|
In command format descriptions, parentheses indicate that you must
enclose choices in parentheses if you specify more than one.
|
|
[ ]
|
In command format descriptions, brackets indicate optional choices. You
can choose one or more items or no items. Do not type the brackets on
the command line. However, you must include the brackets in the syntax
for OpenVMS directory specifications and for a substring specification
in an assignment statement.
|
|
|
|
In command format descriptions, vertical bars separate choices within
brackets or braces. Within brackets, the choices are optional; within
braces, at least one choice is required. Do not type the vertical bars
on the command line.
|
|
{ }
|
In command format descriptions, braces indicate required choices; you
must choose at least one of the items listed. Do not type the braces on
the command line.
|
|
bold type
|
Bold type represents the introduction of a new term. It also represents
the name of an argument, an attribute, or a reason.
|
|
italic type
|
Italic type indicates important information, complete titles of
manuals, or variables. Variables include information that varies in
system output (Internal error
number), in command lines (/PRODUCER=
name), and in command parameters in text (where
dd represents the predefined code for the device type).
|
|
UPPERCASE TYPE
|
Uppercase type indicates a command, the name of a routine, the name of
a file, or the abbreviation for a system privilege.
|
|
Example
|
This typeface indicates code examples, command examples, and
interactive screen displays. In text, this type also identifies URLs,
UNIX commands and pathnames, PC-based commands and folders, and certain
elements of the C programming language.
|
|
-
|
A hyphen at the end of a command format description, command line, or
code line indicates that the command or statement continues on the
following line.
|
|
numbers
|
All numbers in text are assumed to be decimal unless otherwise noted.
Nondecimal radixes---binary, octal, or hexadecimal---are explicitly
indicated.
|
Chapter 1
Overview
This chapter answers the following questions:
- What is the HP Availability Manager?
- How does the Availability Manager work?
- How does the Availability Manager maintain security?
- How does the Availability Manager identify possible performance problems?
1.1 What Is the HP Availability Manager?
The HP Availability Manager is a system management tool that allows you
to monitor, from an OpenVMS or Windows node, one or more OpenVMS nodes
on an extended local area network (LAN).
The Availability Manager helps
system managers and analysts target a specific node or process for
detailed analysis. This tool collects system and process data from
multiple OpenVMS nodes simultaneously, analyzes the data, and displays
the output using a graphical user interface (GUI).
Features and Benefits
The Availability Manager offers many features that can help system managers
improve the availability, accessibility, and performance of OpenVMS
nodes and clusters.
| Feature |
Description |
|
Immediate notification of problems
|
Based on its analysis of data, the Availability Manager notifies you
immediately if any node you are monitoring is experiencing a
performance problem, especially one that affects the node's
accessibility to users. At a glance, you can see whether a problem is a
persistent one that warrants further investigation and correction.
|
|
Centralized management
|
Provides centralized management of remote nodes within an extended
local area network (LAN).
|
|
Intuitive interface
|
Provides an easy-to-learn and easy-to-use graphical user interface
(GUI). An earlier version of the tool, DECamds, uses a
Motif GUI to display information about OpenVMS nodes. The Availability Manager
uses a Java
GUI to display information about OpenVMS nodes on an OpenVMS or a
Windows node.
|
|
Correction capability
|
Allows real-time intervention, including adjustment of node and process
parameters, even when remote nodes are hung.
|
|
Uses its own protocol
|
An important advantage of the
Availability Manager is that it uses its own network protocol. Unlike
most performance monitors,
the Availability Manager does not rely on TCP/IP or any other standard
protocol. Therefore, even if a standard protocol is unavailable, the
Availability Manager can continue to operate.
|
|
Customization
|
Using a wide range of customization options, you can customize the
Availability Manager to meet the requirements of your particular site.
For example, you can change the severity levels of the events that are
displayed and escalate their importance.
|
|
Scalability
|
Makes it easier to monitor multiple OpenVMS nodes.
|
Figure 1-1 is an example of the initial System Overview window of the
Availability Manager.
Figure 1-1 System Overview Window
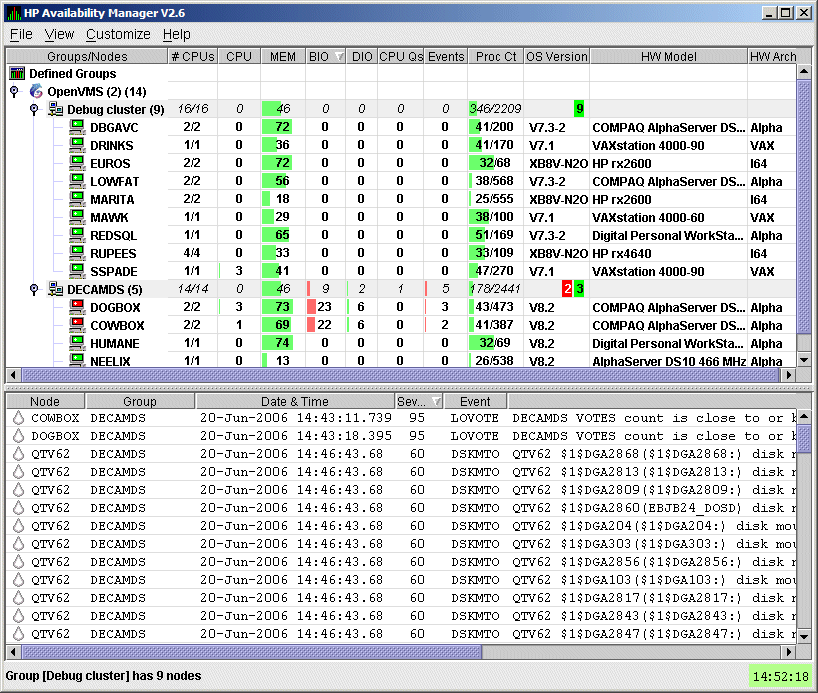
The System Overview window is divided into the following sections:
- In the upper section of the display is a list of user-defined
groups and a list of nodes in each group. You can compress the display
to only the name of a group by clicking the handle preceding the group
name. The summary group line remains, showing the collected information
for all the nodes in the group.
If a node name displays a red icon,
you can hold the cursor over the icon, the node name, or the number in
the Events column to display a tooltip explaining what the problem is;
for example, for the node DBGAVC, the following message is displayed:
HIHRDP, high hard page fault rate
|
This section of the window is called the Group/Node
pane.
- In the lower section of the window events are posted, alerting you
to possible problems on your system. The items on the pane vary,
depending on the severity of the problem: the most severe problems are
displayed first. This section of the window is called the Event
pane.
1.2 How Does the Availability Manager Work?
The Availability Manager uses two types of nodes to monitor systems:
- One or more OpenVMS Data Collector nodes, which contain the
software that collects data.
- An OpenVMS or a Windows Data Analyzer node, which contains the
software that analyzes the
collected data.
The Data Analyzer and Data Collector nodes communicate over an extended
LAN
using an IEEE 802.3 Extended Packet format protocol. Once a connection
is established, the Data Analyzer instructs the Data Collector to
gather specific system and process data.
Although you can run the Data Analyzer as a member of a monitored
cluster, it is typically run on a system that is not a member of a
monitored cluster. In this way, the Data Analyzer will not hang if the
cluster hangs.
Only one Data Analyzer at a time should be running on each node;
however, more than one can be running in the LAN at any given time.
Figure 1-2 shows a possible configuration of Data Analyzer and Data
Collector nodes.
Figure 1-2 Availability Manager Node Configuration

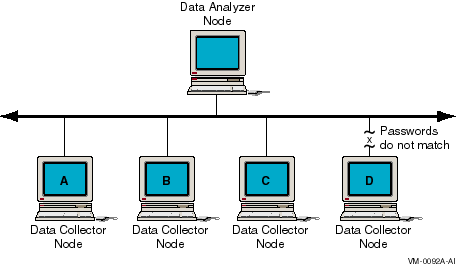
In Figure 1-2, the Data Analyzer can monitor nodes A, B, and C across
the network. The password on node D does not match the password of the
Data Analyzer; therefore, the Data Analyzer cannot monitor node D.
For information about password security, see Section 1.3.
Requesting and Receiving Information
After installing the Availability Manager software, you can begin to
request information from one or more Data Collector nodes.
Requesting and receiving information requires the Availability Manager to
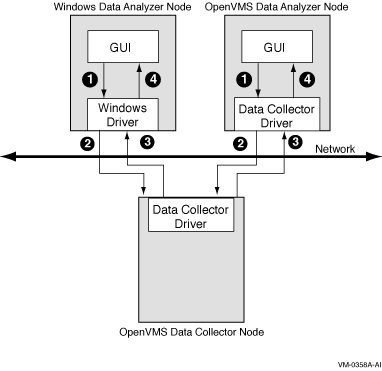
perform a number of steps, which are shown in Figure 1-3 and
explained after the figure.
Figure 1-3 Requesting and Receiving Information

The following steps correspond to the numbers in Figure 1-3.
- The GUI communicates users' requests for data
to the driver on the Data Analyzer node:
- On Windows systems, the Windows driver is part of the Windows kit.
- On OpenVMS systems, the OpenVMS driver is called the Data Collector
driver and is included in the Data Collector kit. This is the same
driver that is on the Data Collector node.
- The driver on the Data Analyzer sends users'
requests across the network to the driver on the Data Collector node.
- The driver on the Data Collector transmits the
requested information over the network to the driver on the Data
Analyzer node.
- The driver on the Data Analyzer node passes
the requested information to the GUI, which displays the data.
In step 4, the Availability Manager also checks the data for any events that
should be posted. The following section explains in more detail how
data analysis and event detection work.
Note
More than one Windows or OpenVMS Data Analyzer node can collect data
from the same Data Collector node.
|
Communicating Through a Private LAN Transport
The Availability Manager protocol is based on the 802.3 Extended Packet Format
(also
known as SNAP). The IEEE Availability Manager protocol values are as follows:
        Protocol ID:        08-00-2B-80-48
        Multicast Address:  09-00-2B-02-01-09
|
If your routers filter protocols in your network, add these values to
your network protocols so that the private transport is propagated over
the routers.
The Availability Manager uses passwords to maintain security. Passwords are
eight alphanumeric characters long.
The Data Analyzer stores passwords in its customization file.
On OpenVMS Data Collector nodes, passwords are part of a three-part
security code called a security triplet.
The following sections explain these security methods further.
For monitoring to take place, the password on a Data Analyzer node must
match the password section of the security triplet on each OpenVMS Data
Collector node. OpenVMS Data Collectors also impose other security
measures, which are explained in Section 1.3.2.
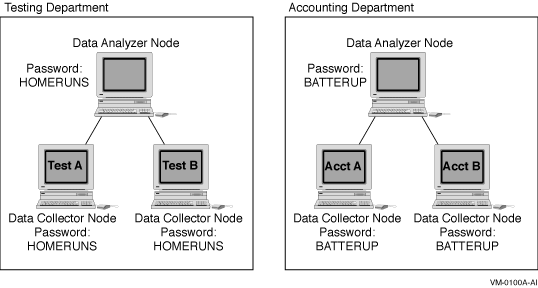
Figure 1-4 illustrates how you can use passwords to limit access to
node information.
Figure 1-4 Availability Manager Password Matching

As shown in Figure 1-4, the Testing Department's Data Analyzer, whose
password is HOMERUNS, can access only OpenVMS Data Collector nodes with
the HOMERUNS password as part of their security triplets. The same is
true of the Accounting Department's Data Analyzer, whose password is
BATTERUP; it can access only OpenVMS Data Collector nodes with the
BATTERUP password as part of their security triplets.
The Availability Manager sets a default password when you install the Data
Analyzer. To change that password, you must use the OpenVMS Security
Customization page (see Figure 7-21), which is explained in
Chapter 7.
OpenVMS Data Collector nodes have the following security features:
- Availability Manager data-transfer security
Each
OpenVMS node running as a Data Collector has a file containing a list
of security triplets. For Data Analyzer and Data Collector nodes to
exchange data, the passwords on these nodes must match.
In
addition, the triplet specifies the type of access a Data Analyzer has.
By specifying the hardware address of the Data Analyzer, the triplet
can also restrict which Data Analyzer nodes are able to access the Data
Collector.
Section 1.3.3 explains security triplets and how to edit
them.
- Availability Manager security log
An OpenVMS Data Collector logs all access denials and executed
write instructions to the operator communications manager (OPCOM).
Messages are displayed on all terminals that have OPCOM enabled (with
the REPLY/ENABLE command). OPCOM also puts messages in the
SYS$MANAGER:OPERATOR.LOG file.
Each security log entry contains the
network address of the initiator. If access is denied, the log entry
also indicates whether a read or write was attempted. If a write
operation was performed, the log entry indicates the process identifier
(PID) of the affected process.
- OpenVMS file protection and process privileges
When the Availability Manager is installed, it creates a directory
(SYS$COMMON:[AMDS$AM]) and sets directory and file protections on it so
that only the SYSTEM account can read the files in that directory. For
additional security on these system-level directories and files, you
can create access control lists (ACLs) to restrict and set alarms on
write access to the security files.
For more information about
creating ACLs, see the HP OpenVMS Guide to System Security.
1.3.3 Changing Security Triplets on OpenVMS Data Collector Nodes
To change security triplets on an OpenVMS Data Collector node, you must
edit the AMDS$DRIVER_ACCESS.DAT file, which is installed on all Data
Collector nodes. The following sections explain what a security triplet
is, how the Availability Manager uses it, and how to change it.
|
