 |
HP Availability Manager User's Guide
Order Number:
AA-RNSJD-TE
January 2005
This guide explains how to use HP Availability Manager software to
detect and correct system availability problems.
Revision/Update Information:
This guide supersedes the HP OpenVMS Availability Manager User's Guide, Version 2.3-1.
Operating System:
Data Analyzer: Windows 2000 SP 4 or higher; Windows XP
SP 1;
OpenVMS Alpha Version 7.2-1 or later
OpenVMS I64 Version 8.2 or later
Data Collector: OpenVMS Alpha and
VAX Version 6.2 or higher,
OpenVMS I64 Version 8.2 or higher
Software Version:
HP Availability Manager Version 2.4-1
Hewlett-Packard Company Palo Alto, California
© 2005 Hewlett-Packard Development Company, L.P.
Confidential computer software. Valid license from HP required for
possession, use or copying. Consistent with FAR 12.211 and 12.212,
Commercial Computer Software, Computer Software Documentation, and
Technical Data for Commercial Items are licensed to the U.S. Government
under vendor's standard commercial license.
The information contained herein is subject to change without notice.
The only warranties for HP products and services are set forth in the
express warranty statements accompanying such products and services.
Nothing herein should be construed as constituting an additional
warranty. HP shall not be liable for technical or editorial errors or
omissions contained herein.
Intel and Itanium are trademarks or registered trademarks of Intel
Corporation or its subsidiaries in the United States and other
countries.
Printed in the US
ZK6552
The HP OpenVMS documentation set is available on CD-ROM.
Preface
Intended Audience
This guide is intended for system managers who install and use HP
Availability Manager software. It is assumed that the system managers
who use this product are familiar with Windows terms and functions.
Note
The term Windows as it is used in this manual refers to either Windows
2000 or Windows XP but not to any other Windows product.
|
Document Structure
This guide contains the following chapters and appendixes:
- Chapter 1 provides an overview of Availability Manager software,
including security features.
- Chapter 2 tells how to start the Availability Manager, use the
main Application window, select a group of nodes and individual nodes,
and use online help.
- Chapter 3 tells how to select nodes and display node data; it
also explains what that data is.
- Chapter 4 tells how to display OpenVMS Cluster summary and
detailed data; it also explains what that data is.
- Chapter 5 tells how to display and interpret events.
- Chapter 6 tells how to take a variety of corrective called
fixes, to improve system availability.
- Chapter 7 describes the tasks you can perform to filter, select,
and customize the display of data and events.
- Appendix A contains a table of CPU process states, which are
referred to in Section 3.2.2.4 and in Section 3.3.1.
- Appendix B contains a table of OpenVMS and Windows events that
can be displayed in the Events pane discussed in Chapter 5.
- Appendix C describes the events that can be signaled for each
type of OpenVMS data that is collected.
Related Documents
The following manuals provide additional information:
- HP OpenVMS System Manager's Manual describes tasks for managing an OpenVMS system. It
also describes installing a product with the POLYCENTER Software
Installation utility.
- HP OpenVMS System Management Utilities Reference Manual describes utilities you can use to manage an OpenVMS
system.
- HP OpenVMS Programming Concepts Manual explains OpenVMS lock management concepts.
For additional information about HP OpenVMS products and services,
visit the following World Wide Web address:
http://www.hp.com/go/openvms
|
Reader's Comments
HP welcomes your comments on this manual. Please send comments to
either of the following addresses:
|
Internet
|
openvmsdoc@hp.com
|
|
Postal Mail
|
Hewlett-Packard Company
OSSG Documentation Group, ZKO3-4/U08
110 Spit Brook Rd.
Nashua, NH 03062-2698
|
How to Order Additional Documentation
For information about how to order additional documentation, visit the
following World Wide Web address:
http://www.hp.com/go/openvms/doc/order
|
Conventions
The following conventions are used in this guide:
|
Ctrl/
x
|
A sequence such as Ctrl/
x indicates that you must hold down the key labeled Ctrl while
you press another key or a pointing device button.
|
|
PF1
x
|
A sequence such as PF1
x indicates that you must first press and release the key
labeled PF1 and then press and release another key or a pointing device
button.
|
|
[Return]
|
In examples, a key name enclosed in a box indicates that you press a
key on the keyboard. (In text, a key name is not enclosed in a box.)
In the HTML version of this document, this convention appears as
brackets, rather than a box.
|
|
...
|
A horizontal ellipsis in examples indicates one of the following
possibilities:
- Additional optional arguments in a statement have been omitted.
- The preceding item or items can be repeated one or more times.
- Additional parameters, values, or other information can be entered.
|
.
.
.
|
A vertical ellipsis indicates the omission of items from a code example
or command format; the items are omitted because they are not important
to the topic being discussed.
|
|
( )
|
In command format descriptions, parentheses indicate that you must
enclose choices in parentheses if you specify more than one.
|
|
[ ]
|
In command format descriptions, brackets indicate optional choices. You
can choose one or more items or no items. Do not type the brackets on
the command line. However, you must include the brackets in the syntax
for OpenVMS directory specifications and for a substring specification
in an assignment statement.
|
|
|
|
In command format descriptions, vertical bars separate choices within
brackets or braces. Within brackets, the choices are optional; within
braces, at least one choice is required. Do not type the vertical bars
on the command line.
|
|
{ }
|
In command format descriptions, braces indicate required choices; you
must choose at least one of the items listed. Do not type the braces on
the command line.
|
|
bold type
|
Bold type represents the introduction of a new term. It also represents
the name of an argument, an attribute, or a reason.
|
|
italic type
|
Italic type indicates important information, complete titles of
manuals, or variables. Variables include information that varies in
system output (Internal error
number), in command lines (/PRODUCER=
name), and in command parameters in text (where
dd represents the predefined code for the device type).
|
|
UPPERCASE TYPE
|
Uppercase type indicates a command, the name of a routine, the name of
a file, or the abbreviation for a system privilege.
|
|
Example
|
This typeface indicates code examples, command examples, and
interactive screen displays. In text, this type also identifies URLs,
UNIX commands and pathnames, PC-based commands and folders, and certain
elements of the C programming language.
|
|
-
|
A hyphen at the end of a command format description, command line, or
code line indicates that the command or statement continues on the
following line.
|
|
numbers
|
All numbers in text are assumed to be decimal unless otherwise noted.
Nondecimal radixes---binary, octal, or hexadecimal---are explicitly
indicated.
|
Chapter 1
Overview
This chapter answers the following questions:
- What is the HP Availability Manager?
- How does the Availability Manager work?
- How does the Availability Manager identify possible performance problems?
- How does the Availability Manager maintain security?
1.1 What Is the HP Availability Manager?
The HP Availability Manager is a system management tool that allows you
to monitor, from an OpenVMS or Windows node, one or more OpenVMS nodes
on an extended local area network (LAN).
The Availability Manager helps
system managers and analysts target a specific node or process for
detailed analysis. This tool collects system and process data from
multiple OpenVMS nodes simultaneously, analyzes the data, and displays
the output using a graphical user interface (GUI).
Features and Benefits
The Availability Manager offers many features that can help system managers
improve the availability, accessibility, and performance of OpenVMS
nodes and clusters.
| Feature |
Description |
|
Immediate notification of problems
|
Based on its analysis of data, the Availability Manager notifies you
immediately if any node you are monitoring is experiencing a
performance problem, especially one that affects the node's
accessibility to users. At a glance, you can see whether a problem is a
persistent one that warrants further investigation and correction.
|
|
Centralized management
|
Provides centralized management of remote nodes within an extended
local area network (LAN).
|
|
Intuitive interface
|
Provides an easy-to-learn and easy-to-use graphical user interface
(GUI). An earlier version of the tool, DECamds, uses a
Motif GUI to display information about OpenVMS nodes. The Availability Manager
uses a Java
GUI to display information about OpenVMS nodes on an OpenVMS or a
Windows node.
|
|
Correction capability
|
Allows real-time intervention, including adjustment of node and process
parameters, even when remote nodes are hung.
|
|
Uses its own protocol
|
An important advantage of the
Availability Manager is that it uses its own network protocol. Unlike
most performance monitors,
the Availability Manager does not rely on TCP/IP or any other standard
protocol. Therefore, even if a standard protocol is unavailable, the
Availability Manager can continue to operate.
|
|
Customization
|
Using a wide range of customization options, you can customize the
Availability Manager to meet the requirements of your particular site.
For example, you can change the severity levels of the events that are
displayed and escalate their importance.
|
|
Scalability
|
Makes it easier to monitor multiple OpenVMS nodes.
|
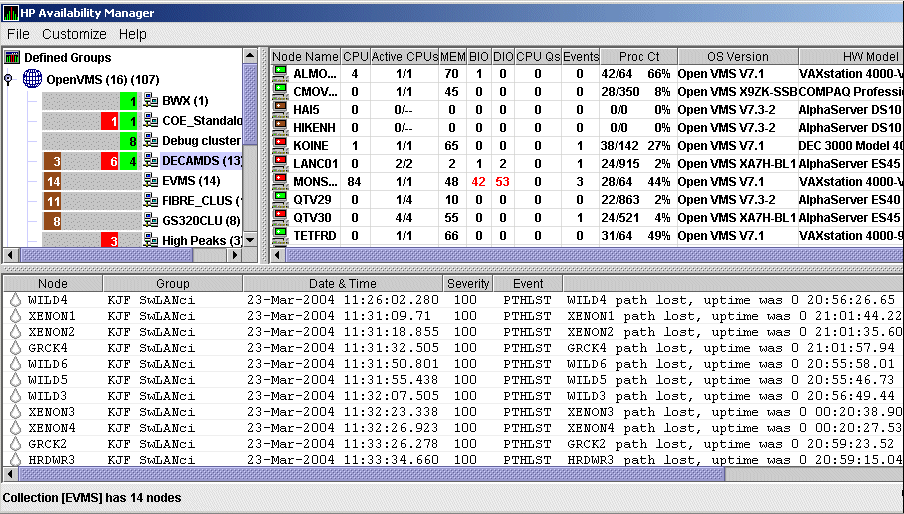
Figure 1-1 is an example of the initial Application window of the
Availability Manager.
Figure 1-1 Application Window

The Application window is divided into the following sections:
- In the upper left section of the window is a list of user-defined
groups of nodes. You can click either the name of a group or the icon
in front of it to select a group.
- In the upper right section is a list of the nodes in the group you
selected. Double-click a node name or the icon in front of it to
display more detailed data for that node. You can also double-click
data items in each row to display more detailed data about a specific
item.
- In the lower section events are posted, alerting you to possible
problems on your system.
1.2 How Does the Availability Manager Work?
The Availability Manager uses two types of nodes to monitor systems:
- One or more OpenVMS Data Collector nodes, which contain the
software that collects data.
- An OpenVMS or a Windows Data Analyzer node, which contains the
software that analyzes the
collected data.
The Data Analyzer and Data Collector nodes communicate over an extended
LAN
using an IEEE 802.3 Extended Packet format protocol. Once a connection
is established, the Data Analyzer instructs the Data Collector to
gather specific system and process data.
Although you can run the Data Analyzer as a member of a monitored
cluster, it is typically run on a system that is not a member of a
monitored cluster. In this way, the Data Analyzer will not hang if the
cluster hangs.
Only one Data Analyzer at a time should be running on each node;
however, more than one can be running in the LAN at any given time.
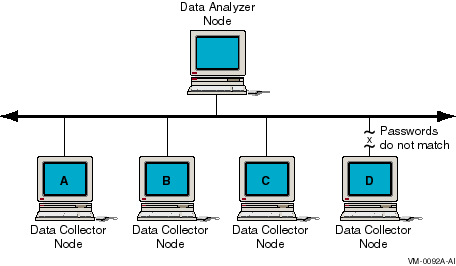
Figure 1-2 shows a possible configuration of Data Analyzer and Data
Collector nodes.
Figure 1-2 Availability Manager Node Configuration

In Figure 1-2, the Data Analyzer can monitor nodes A, B, and C across
the network. The password on node D does not match the password of the
Data Analyzer; therefore, the Data Analyzer cannot monitor node D.
For information about password security, see Section 1.4.
Requesting and Receiving Information
After installing the Availability Manager software, you can begin to
request information from one or more Data Collector nodes.
Requesting and receiving information requires the Availability Manager to
perform a number of steps, which are shown in Figure 1-3 and
explained after the figure.
Figure 1-3 Requesting and Receiving Information

The following steps correspond to the numbers in Figure 1-3.
- The GUI communicates users' requests for data
to the driver on the Data Analyzer node.
- The Data Analyzer driver sends users' requests
across the network to a driver on a Data Collector node.
- The Data Collector driver transmits the
requested information over the network to the driver on the Data
Analyzer node.
- The Data Analyzer driver passes the requested
information to the GUI, which displays the data.
In step 4, the Availability Manager also checks the data for any events that
should be posted. The following section explains in more detail how
data analysis and event detection work.
When the Availability Manager detects problems on your system, it uses
a combination of methods to bring these problems to the attention of
the system manager. If no data display is open for a particular node,
the Availability Manager reduces the data collection
interval so that data can be analyzed more closely.
Performance events are also posted in the Event pane, which is in the
lower portion of the Application window (Figure 1-1).
The following topics are related to detecting problems and posting
events:
- Collecting and analyzing data
- Posting events
1.3.1 Collecting and Analyzing Data
This section explains how the Availability Manager collects and analyzes data.
It also defines terms related to data collection and analysis.
You can use the Availability Manager to collect data either as a background
activity or as a foreground activity.
1.3.1.2 Events and Data Collection
An event is a problem or potential problem associated
with resource availability. Users can customize criteria for events.
Events are associated with types of data collected.
For example, collection of CPU data is associated with the PRCCUR,
PRCMWT, and PRCPWT events. (Appendix B describes events, and
Appendix C describes the events that each type of data can signal.)
When the GUI requests one type of data from the Data Collector (for
example, CPU data for all the processes on the system), a snapshot is
taken of that type of data. This snapshot is considered one
data collection.
Data collection intervals, which are displayed on the
Data Collection customization page
(Figure 1-4), specify the frequency of data collection. Table 1-1
describes these intervals.
Table 1-1 Data Collection Intervals
| Interval (in seconds) |
Type of Data Collection |
Description |
|
NoEvent
|
Background
|
How often data is collected if no events have been posted for that type
of data.
The Availability Manager starts background data collection at the
NoEvent interval (for example, every 75 seconds). If
no events have been posted for that type of data, the Availability
Manager starts a new collection cycle every 75 seconds.
|
|
Event
|
Background
|
How often data is collected if any events have been posted for that
type of data.
The Availability Manager continues background data collection at the
Event interval until all events for that type of data
have been removed from the Event pane. Data collection then resumes at
the
NoEvent interval.
|
|
Display
|
Foreground
|
How often data is collected when the page for a specific node is open.
The Availability Manager starts foreground data collection at the
Display interval and continues this rate of collection
until the display is closed. Data collection then resumes as a
background activity.
|
1.3.2 Posting Events
The Availability Manager evaluates each data collection for events. The
Availability Manager posts events when data values in a data collection meet or
exceed user-defined thresholds and occurrences.
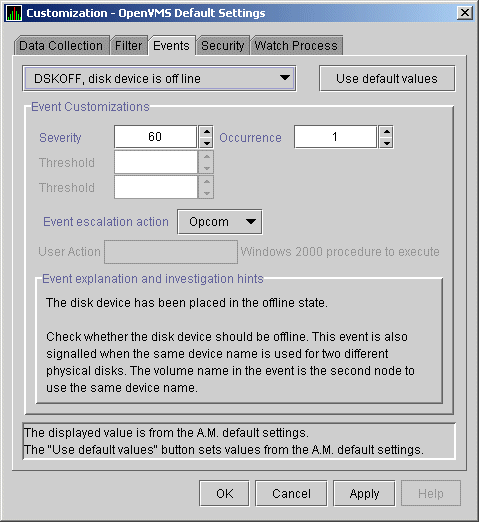
Values for thresholds and occurrences are displayed on Event
Customization pages similar to the one shown in Figure 1-6.
Thresholds and occurrences are described in the next section.
Figure 1-6 Sample Event Customization Page

|
