Software > OpenVMS Systems > Documentation > 82final > 6552 HP OpenVMS Systems Documentation |
HP Availability Manager User's Guide
2.4.3 Sorting DataYou can sort data in many OpenVMS displays, for example:
Depending on the field, you can sort data alphabetically or numerically. An alphabetical sort is performed using ASCII character values; for example, dollar signs ($) precede letters in the sort order. To sort the values in a field, double-click the corresponding column heading. To reverse the sort order, double-click the column heading again. 2.5 Getting HelpTo obtain online help, click the Help menu on the Application window menu bar. Then choose one of the following options:
2.6 Printing an Availability Manager PageThe Availability Manager does not provide a printscreen capability. However, you can capture Availability Manager pages and print them by following these steps:
Chapter 3
|
Before you start this chapter, be sure to read the explanation of data collection, events, thresholds, and occurrences in Chapter 1. HP also recommends completing the getting-started steps described in Chapter 2. |
Node summary data is the only data that is collected by default. The Availability Manager looks for events only in data that is being collected.
You can collect additional data in either of the following ways:
See Chapter 1 and Chapter 7 for details.
This chapter describes the node data that the Availability Manager displays by default and more detailed data that you can choose to display. Differences are noted whenever information displayed for OpenVMS nodes differs from that displayed for Windows nodes.
Although Cluster Summary is one of the tabs displayed on the OpenVMS Node Summary page (see Figure 3-4), see Chapter 4 for a detailed discussion of OpenVMS Cluster data.
On many node displays, you can hold the cursor over a data field or column header to display an explanation of that field or header in a little rectangle, called a tooltip. Figure 3-2 contains an example. |
Figure 3-1 OpenVMS Node Pane

Recall that the colors of the icons represent the following states:
| Color | Description |
|---|---|
| Brown | Attempts to configure the node have failed---for example, because it failed the security check. |
| Yellow | Node security check is in progress or has failed. |
| Black | Path to node has been lost. |
| Red | Security check was successful. However, a threshold has been exceeded, and an event has been posted. |
| Green | Security check was successful; data is being collected. |
The following sections describe the data displayed for OpenVMS and Windows Node panes.
Node pane data displayed in red on your screen indicates that the amount is above the threshold set for that field. For each OpenVMS node and group it recognizes, the Availability Manager displays the data described in Table 3-1. This table also lists the abbreviation of the event that is related to each type of data, where applicable. See Section 7.6 for information about setting event thresholds. Appendix B describes OpenVMS and Windows events.
Note that you can sort the order in which data is displayed in the Node Pane by clicking a column header. To reverse the sort order of a column of data, click the column header again.
| Data | Description of Data | Related Event |
|---|---|---|
| Node Name | Name of the node being monitored. | n/a |
| CPU 1 | Percentage of CPU usage of all processes on the node. |
HICOMQ
HIMTTO PRCCUR PRCPUL |
| Active CPUs | The number of active CPUs over the number of CPUs in the potential set of CPUs. | n/a |
| MEM | Percentage of space in memory that all processes on the node use. | LOMEMY |
| BIO | Buffered I/O rate of processes on the node. | HIBIOR |
| DIO | Direct I/O usage of processes on the node. | HIDIOR |
| CPU Qs | Number of processes in one of the following states: MWAIT, COLPG, PFW, FPG. |
HIMWTQ
PRCMWT HIPWTQ PRCPUT |
| Events | Number of triggered events that are associated with this node. | List of relevant events |
| Proc Ct | Actual count of processes over the maximum number of processes. Percentage of actual to maximum processes. | HIPRCT |
| OS Version | Version of the operating system on the node. |
NOPLIB
UNSUPP |
| HW Model | Hardware model of the node. |
NOPLIB
UNSUPP |
| HW Arch | Hardware architecture: Alpha or VAX | n/a |
By holding the cursor over many column headers and some data items on Availability Manager screens, you can display a tooltip. Figure 3-2 is an example of a tooltip that explains the CPU Queues column header in the Node Pane.
Figure 3-2 Sample Tooltip

Figure 3-3 is an example of a Windows Node pane. From the group you select, the Availability Manager displays all the nodes with which it can communicate.
Figure 3-3 Windows Node Pane

For each Windows node in the group, the Availability Manager displays the data shown in Table 3-2.
| Data | Description |
|---|---|
| Node Name | Name of the node being monitored. |
| CPU | Percentage of CPU usage of all the processes on the node. |
| MEM | Percentage of memory that is in use. |
| DIO | Direct I/O usage of processes on the node. |
| Processes | Number of processes on the node. |
| Threads | Number of threads on the node. A thread is a basic executable entity that can execute instructions in a processor. |
| Events | The number of events on the node. An event is used when two or more threads want to synchronize execution. |
| Semaphores | The number of semaphores on the node. Threads use semaphores to control access to data structures that they share with other threads. |
| Mutexes | The number of mutexes on the node. Threads use mutexes to ensure that only one thread executes a section of code at a time. |
| Sections | The number of sections on the node. A section is a portion of virtual memory created by a process for storing data. A process can share sections with other processes. |
| OS Version | Version of the operating system on the node. |
| HW Model | Hardware model of the node. |
The following sections describe node data pages, which you can display in any of the following ways:
The menu bar on each node data page contains the options described in Table 3-3.
| Menu Option | Description | For More Information |
|---|---|---|
| File | Contains the Close option, which you can choose to exit from the pages. | n/a |
| View | Contains options that allow you to view data from another perspective. | See specific pages. |
| Fix | Contains options that allow you to resolve various resource availability problems and improve system performance. | Chapter 6 |
| Customize | Contains options that allow you to organize data collection and analysis and to display data by filtering and customizing Availability Manager data. | Chapter 7 |
The following sections describe individual node data pages.
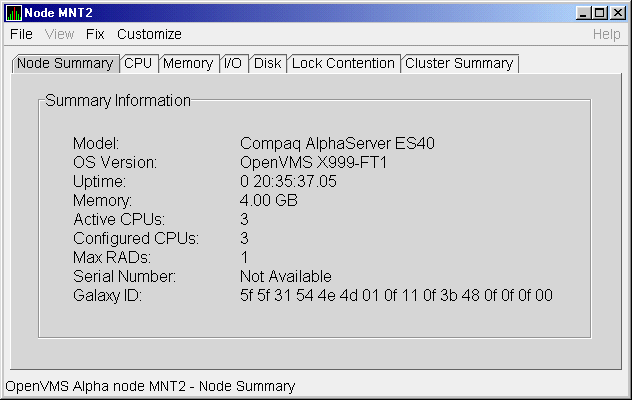
When you double-click a node name, operating system (OS) version, or hardware model in an OpenVMS or Windows Node pane, the Availability Manager displays the Node Summary page (Figure 3-4).
Figure 3-4 Node Summary Page

On this page, the following information is displayed for the node selected:
| Data | Description |
|---|---|
| Model | System hardware model name. |
| OS Version | Name and version of the operating system. |
| Uptime | Time (in days, hours, minutes, and seconds) since the last reboot. |
| Memory | Total amount of physical memory (in megabytes) found on the system. |
| Active CPUs | Number of CPUs running on the node. |
| Configured CPUs | Number of CPUs that are configured to run on the node. |
| Max RADs | Maximum number of resource affinity domains (RADs) for this node. |
| Serial Number | The system's hardware serial number retrieved from the Hardware Restart Parameter Block (HWRPB). |
| Galaxy ID | The Galaxy ID uniquely identifies a Galaxy. Instances in the same Galaxy have the same Galaxy ID. |
By clicking the CPU tab, you can display CPU panes that contain more detailed statistics about CPU mode usage and process summaries than the Node Summary does. You can use the CPU panes to diagnose issues that CPU-intensive users or CPU bottlenecks might cause. For OpenVMS nodes, you can also display information about specific CPU processes.
When you double-click a value under the CPU or CPU Qs heading on either an OpenVMS or a Windows Node pane, or when you click the CPU tab, the Availability Manager displays the CPU Modes Summary in the top pane and, by default in the bottom pane, CPU Modes Detail. You can use the View menu to select the CPU Process Summary in the bottom pane (see Section 3.2.2.4).
CPU modes summaries and process summary panes are described in the following sections. Note that there are differences between the pages displayed for OpenVMS and Windows nodes.
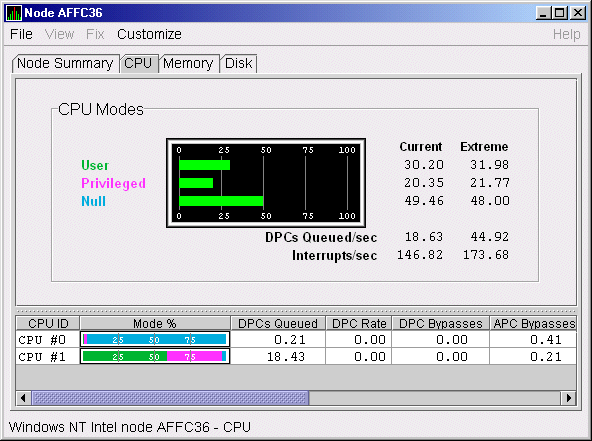
Figure 3-5 Windows CPU Modes Page

The top pane of the Windows CPU Modes page is a summary of Windows CPU usage, listed by type of mode.
On the left, the following CPU modes are listed:
On the graph, values that exceed thresholds are displayed in red. To the right of the graph are current and extreme amounts for each mode.
Current and extreme amounts are also displayed for the following values:
The bottom pane of the Windows CPU Modes contains modes details. The following data is displayed:
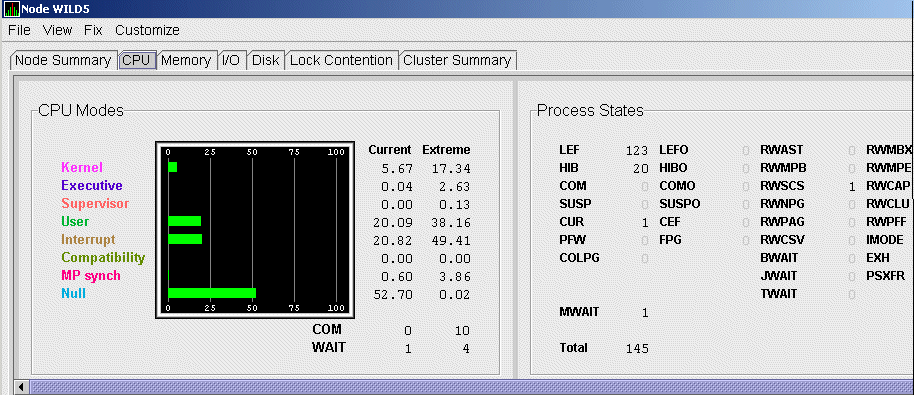
Figure 3-6 shows sample OpenVMS CPU Modes summary and CPU Process States, which are the left and right top panes of the CPU Modes page.
Figure 3-6 OpenVMS CPU Modes Summary and Process States Pane

In the CPU modes section of the pane, percentages are averaged across all the CPUs and are displayed as a single value on symmetric multiprocessing (SMP) nodes.
To the left of the graph is a list of CPU modes. The bars in the graph represent the percentage of CPU cycles used for each mode. Values that are lower than the thresholds are displayed in green; values that exceed thresholds are displayed in red. To the right of the graph are current and extreme percentages of time spent in each mode.
Below the graph, the Availability Manager displays the COM and WAIT process queues:
The right side of Figure 3-6 shows a sample CPU Process States display.
Appendix A contains explanations of the CPU process states. Note that the value for MWAIT, in the left column, is the sum of all values for the states in the two right columns.
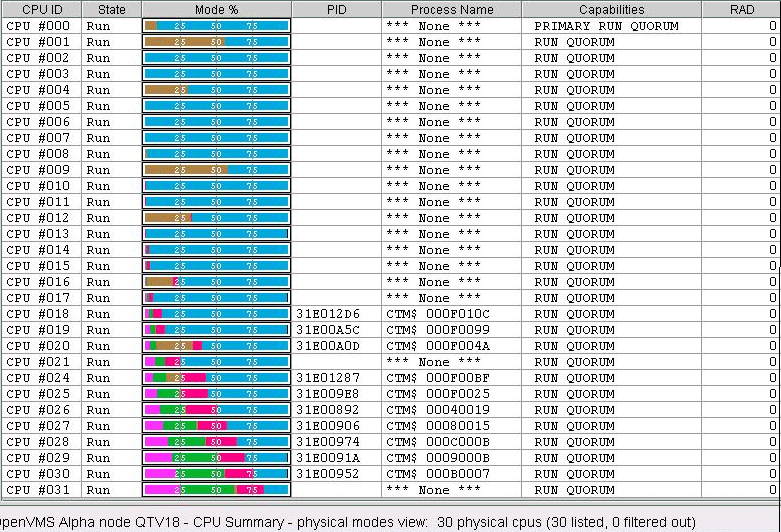
The bottom pane of the CPU Modes page contains CPU modes details, as shown in Figure 3-7.
Figure 3-7 OpenVMS CPU Modes Detail Pane

In the OpenVMS CPU Modes Detail pane, the following data is displayed:
| Data | Description |
|---|---|
| CPU ID | Decimal value representing the identity of a processor in a multiprocessing system. On a uniprocessor, this value is always CPU #00. |
| State | One of the following CPU states: Boot, Booted, Init, Rejected, Reserved, Run, Stopped, Stopping, or Timeout. |
| Mode % | Graphical representation of the percentage of active modes on that CPU. The color displayed coincides with the mode color in the graph in the top pane. |
| PID | Process identifier (PID) value of the process that is using the CPU. If the PID is unknown to the console application, the internal PID (IPID) is listed. |
| Process Name | Name of the process active on the CPU. If no active process is found on the CPU, the name is listed as *** None ***. |
| Capabilities | One or more of the following CPU capabilities: Primary, Quorum, Run, or Vector. |
| RAD | Number of the RAD where the CPU exists. |
| Previous | Next | Contents | Index |