HP OpenVMS Availability Manager User's Guide
3.2.2.2 OpenVMS CPU Mode Summary and Process States
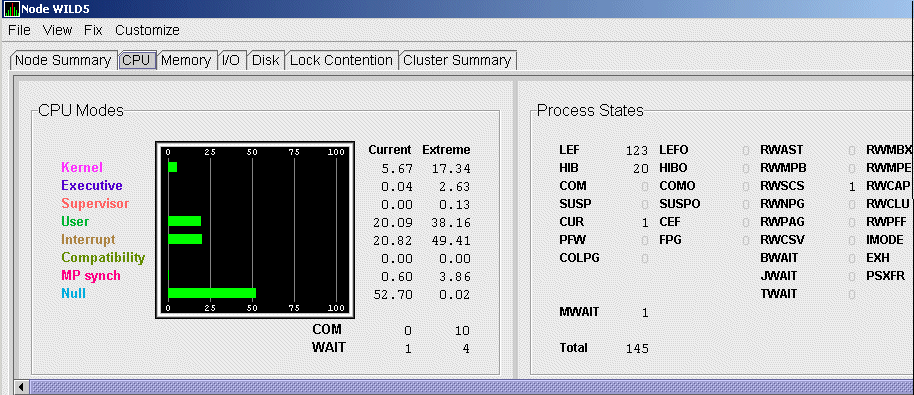
Figure 3-6 shows sample OpenVMS CPU Mode Summary and CPU Process
States, which are the left and right top panes of the CPU Modes page.
Figure 3-6 OpenVMS CPU Mode Summary and Process States
CPU Mode Summary
In the CPU Mode Summary section of the pane, percentages are averaged
across all
the CPUs and are displayed as a single value on symmetric
multiprocessing (SMP) nodes.
To the left of the graph is a list of CPU modes. The bars in the graph
represent the percentage of CPU cycles used for each mode. To the right
of the graph are current and extreme percentages of time spent in each
mode.
Below the graph, the Availability Manager displays the COM and WAIT process
queues:
- COM: The value displayed is the number of processes in the COM and
COMO states.
- WAIT: The value displayed is the number of processes in the
miscellaneous WAIT, MWAIT, COLPG, CEF, PFW, and FPG states.
CPU Process States
The right side of Figure 3-6 shows a sample CPU Process States
display. Note that the value for MWAIT, in the left column, is the sum
of all values for the states in the two right columns.
This display shows the number of processes in each process state. This
number is tallied from the data in CPU Process view of the CPU page
(Figure 3-6). For systems with many processes, the data in the CPU
Process view is collected in segments over a short period of time
because the amount of data a network packet can contain is limited.
Because of this, the number of processes in the Process States pane
might differ slightly from what is reported in $MONITOR STATES.
Appendix A contains explanations of the CPU process states.
The lower pane of the CPU Modes page contains CPU mode details, as
shown in Figure 3-7.
Figure 3-7 OpenVMS CPU Mode Details Pane
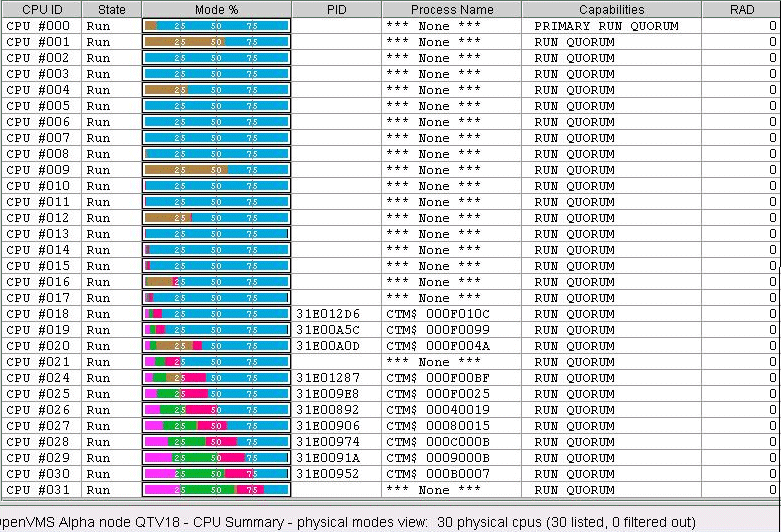
In the OpenVMS CPU Mode Details pane, the following data is displayed:
| Data |
Description |
|
CPU ID
|
Decimal value representing the identity of a processor in a
multiprocessing system. On a uniprocessor, this value is always CPU #00.
|
|
State
|
One of the following CPU states: Boot, Booted, Init, Rejected,
Reserved, Run, Stopped, Stopping, or Timeout.
|
|
Mode %
|
Graphical representation of the percentage of active modes on that CPU.
The color displayed coincides with the mode color in the graph in the
top pane.
|
|
PID
|
Process identifier (PID) value of the process that is using the CPU. If
the PID is unknown to the Data Analyzer application, the internal PID
(IPID) is listed.
|
|
Process Name
|
Name of the process active on the CPU. If no active process is found on
the CPU, the name is listed as *** None ***.
|
|
Capabilities
|
One or more of the following CPU capabilities or flags:
- Capabilities: Primary, Quorum, Run, or Vector.
- Flags: Idle, Lckmgr, Fastpath_CPU, Fastpath_Ports, Low_power, and
Cothread_of_
nn.
|
|
RAD
|
Number of the RAD where the CPU exists.
|
3.2.2.4 OpenVMS CPU Process Summary
To display the OpenVMS CPU Process Summary pane at the bottom of the
CPU page, select CPU Process Summary from the View menu
(Figure 3-6). Figure 3-8 shows a sample OpenVMS CPU Process
Summary pane.
Figure 3-8 OpenVMS CPU Process Summary Pane

The OpenVMS CPU Process Summary pane displays the following data:
| Data |
Description |
|
PID
|
Process identifier, a 32-bit value that uniquely identifies a process.
|
|
Process Name
|
Name of the process active on the CPU.
|
|
Priority
|
Computable
(xx) and base
(yy) process priority in the format
xx/yy.
|
|
State
|
One of the process states listed in Appendix A.
|
|
Rate
|
Percentage of CPU time used by this process. This is the ratio of CPU
time to elapsed time. The CPU rate is also displayed in the bar graph.
|
|
Wait
|
Percentage of time the process is in the COM or COMO state.
|
|
Time
|
Amount of actual CPU time charged to the process.
|
|
Home RAD
|
Where most of the resources of the process reside.
|
Displaying Single Process Information
When you double-click a PID on the lower part of an OpenVMS CPU Process
Summary (Figure 3-8), Memory Summary (Figure 3-10), or I/O Summary
(Figure 3-12) page, the Availability Manager displays the first of several
OpenVMS Single Process pages.
On these pages, you can click tabs to display specific data about one
process. Alternatively, you can display all of the information on the
pages on a single vertical or horizontal grid page.
This data includes a combination of data elements from the CPU Process,
Memory, and I/O pages, as well as data for specific quota utilization,
current image, and queue wait time. These pages are described in more
detail in Section 3.3.
The Memory Summary and Memory Details pages contain statistics about
memory usage on the node you select.
The Memory Summary pages displayed for OpenVMS and Windows nodes are
somewhat different, as described in the following sections. The Memory
Details page exists only for OpenVMS systems.
To display the Windows Memory Summary page, you can use either of the
following methods:
- Double-click a node, and then click the Memory tab (Figure 3-3).
- Double-click a value under the MEM heading (Figure 3-3).
The Availability Manager displays the Windows Memory page (Figure 3-9).
Figure 3-9 Windows Memory
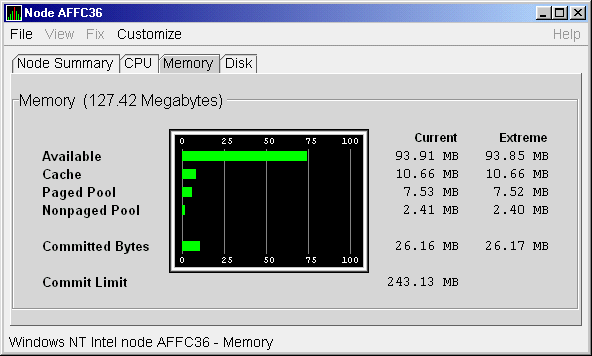
The Current and Extreme amounts on the page display the data shown in
the following table. The table also indicates what the graph amounts
represent.
| Data |
Description |
|
Available
|
Size (in bytes) of the virtual memory currently on the
zeroed, free, and standby lists. Zeroed and free memory are ready for
use, with zeroed memory cleared to zeros. Standby memory is removed
from a process's working set but is still available. The graph shows
the percentage of physical memory that is available for use.
|
|
Cache
|
Number of bytes currently in use by the
system cache. The system cache is used to buffer data retrieved from
disk or LAN. The system cache uses memory not in use by active
processes on the computer. The graph shows the percentage of physical
memory devoted to the cache.
|
|
Paged Pool
|
Number of bytes in paged pool, a system
memory area where operating system components acquire space as they
complete their tasks. Paged pool pages can be paged out to the paging
file when the system does not access them for long periods of time. The
graph shows the percentage of physical memory devoted to paged pool.
|
|
Nonpaged Pool
|
Number of bytes in nonpaged pool, a system
memory area where operating system components acquire space as they
complete their tasks. Nonpaged pool pages cannot be paged out to the
paging file; instead, they remain in memory as long as they are
allocated. The graph shows the percentage of physical memory devoted to
nonpaged pool.
|
|
Committed Bytes
|
Amount of available virtual memory (the Commit Limit) that is in use.
Note that the commit limit can change if the paging file is extended.
The graph shows the percentage of the Commit Limit used by the
Committed Bytes.
|
|
Commit Limit
|
Size (in bytes) of virtual memory that can be committed without having
to extend the paging files. If the paging files can be extended, this
limit can be raised.
|
3.2.3.2 OpenVMS Memory Summary
When you double-click a value under the MEM heading in an OpenVMS Node
pane, or if you click the Memory tab, the Availability Manager displays the
OpenVMS Memory Summary page (Figure 3-10).
Alternatively, if you click the View menu on the OpenVMS Memory Summary
page, the following options are displayed in a shortcut menu:
- Memory Summary View
- Memory Details View
You can click Memory Summary View to select the Memory Summary page.
Figure 3-10 OpenVMS Memory Summary
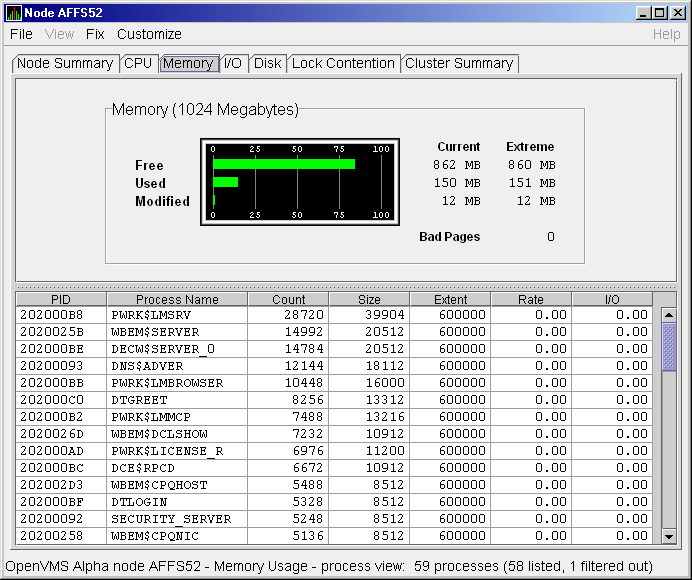
The graph in the top pane of Figure 3-10 shows memory distribution
(Free, Used, and Modified) as absolute values, in megabytes of memory.
Current and extreme values are also listed for each type of memory
distribution. (Free memory uses the lowest seen value as its extreme.)
Bad Pages show the number of pages that the operating system has marked
as bad.
The thresholds that you see in the graph are the ones set for the
LOMEMY event. (The LOMEMY thresholds are also in the display of values
for the MEM field in the OpenVMS Group/Node pane shown in
Figure 2-1.)
The lower pane in Figure 3-10 displays the data shown in the
following table, including an abbreviation of the event that is related
to each type of data, where applicable.
| Data |
Description |
Related Events |
|
PID
|
Process identifier. A 32-bit value that uniquely identifies a process.
|
n/a
|
|
Process Name
|
Name of the process.
|
NOPROC,
PRCFND
|
|
Count
|
Number of physical pages or pagelets of memory that the process is
using for the working set count.
|
LOWEXT
|
|
Size
|
Number of pages or pagelets of memory the process is allowed to use for
the working set size (also known as the working set list size). The
operating system periodically adjusts this value based on an analysis
of page faults relative to CPU time used.
|
LOWSQU
|
|
Extent
|
Number of pages or pagelets of memory in the process's working set
extent (WSEXTENT) quota as defined in the user authorization file
(UAF). Number of pages or pagelets cannot exceed the value of the
system parameter WSMAX.
|
LOWEXT
|
|
Rate
|
Number of page faults per second for the process.
|
LOWSQU,
LOWEXT,
PRPGFL
|
|
I/O
|
Rate of I/O read attempts necessary to satisfy page faults (also known
as page read I/O or the hard fault rate).
|
PRPIOR
|
When you double-click a PID on the lower part of the Memory Summary
page (Figure 3-10), the Availability Manager displays an OpenVMS Single
Process (Figure 3-23), where you can click tabs to display pages
containing specific data about one process. This data includes a
combination of data from the CPU Process, Memory, and I/O pages, as
well as data for specific quota utilization, current image, and queue
wait time. These pages are described in Section 3.3.
When you click the View menu on the OpenVMS Memory Summary page
(Figure 3-10), the following options are displayed in a shortcut
menu. To display memory details, select that option.
- Memory Summary View
- Memory Details View (Alpha only)
The Availability Manager displays the OpenVMS Memory Details page
(Figure 3-11).
Figure 3-11 OpenVMS Memory Details
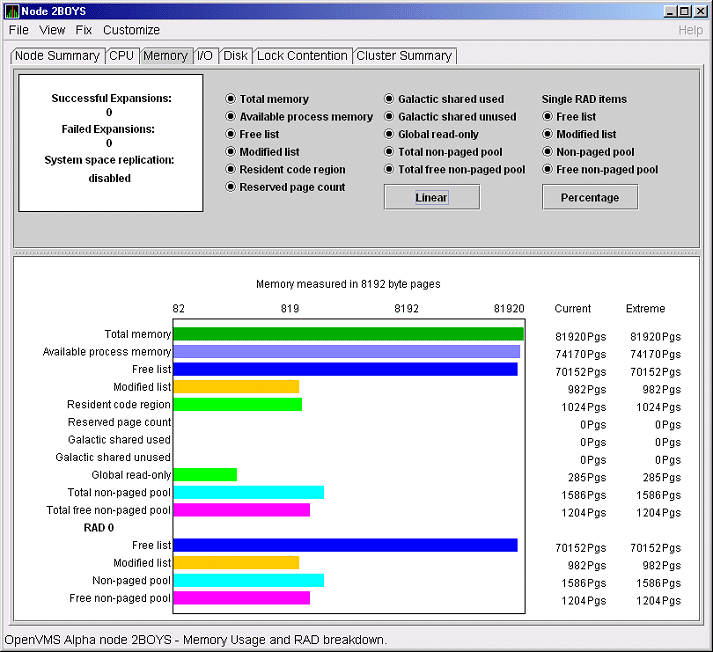
The following data items are in a box at the top left of the page:
| Heading |
Description |
|
Successful Expansions
|
Number of successful nonpaged pool expansions.
|
|
Failed Expansions
|
Number of failed attempts to expand nonpaged pool.
|
|
System space replication
|
Whether system space replication is enabled or disabled.
|
To the right of the box is a list of system memory data that is
displayed in the bar graphs at the bottom of the page. You can toggle
these data items on or off (that is, to display them as bar graphs).
You can also click a small box to choose between Linear and Logarithmic
bar graph displays.
The system memory data items are described in Table 3-5.
Table 3-5 System Memory Data
| Data |
Description |
|
Total memory
|
Total physical memory size, as seen by OpenVMS.
|
|
Available process memory
|
Amount of total physical memory available to processes. This is the
total memory minus memory allocated to OpenVMS.
|
|
Free list
|
Size of the free page list.
|
|
Modified list
|
Size of the modified page list.
|
|
Resident code region
|
Size of the resident image code region.
|
|
Reserved page count
|
Number of reserved memory pages.
|
|
Galactic shared used
|
Galaxy shared memory pages currently in use.
|
|
Galactic shared unused
|
Galaxy shared memory pages currently not in use.
|
|
Global read-only
|
Read-only pages, which are installed as resident when system space
replication is enabled, that will also be replicated for improved
performance.
|
|
Total nonpaged pool
|
Total size of system nonpaged pool.
|
|
Total free nonpaged pool
|
Amount of nonpaged pool that is currently free.
|
To the right of the system memory data is a list of single RAD data
items, which are described in Section 3.3.7. You can toggle these items
to display them in bar graphs.
Table 3-6 Single RAD Data Items
| Data |
Description |
|
Free list
|
Size of the free page list.
|
|
Modified list
|
Size of the modified page list.
|
|
Nonpaged pool
|
Total size of system nonpaged pool.
|
|
Free nonpaged pool
|
Amount of nonpaged pool that is currently free.
|
Below the list of single RAD items is a box where you can toggle
between Percentage and Raw Data to display Current and Extreme values
to the right of the bar graphs.
By clicking the I/O tab on any OpenVMS node data page, you can display
a page that contains summaries of accumulated I/O rates. In the top
pane, the summary covers all processes; in the lower pane, the summary
is for one process.
From the View menu, you can also choose to display (in the lower pane)
a list of page and swap files.
The OpenVMS I/O Summary page displays the rate, per second, at which
I/O transfers take place, including paging write I/O (WIO), direct I/O
(DIO), and buffered I/O (BIO). In the top pane, the summary is for all
CPUs; in the lower pane, the summary is for one process.
When you double-click a data item under the DIO or BIO heading on the
Node pane, or if you click the I/O tab, the Availability Manager displays, by
default, the OpenVMS I/O Summary (Figure 3-12).
Figure 3-12 OpenVMS I/O Summary
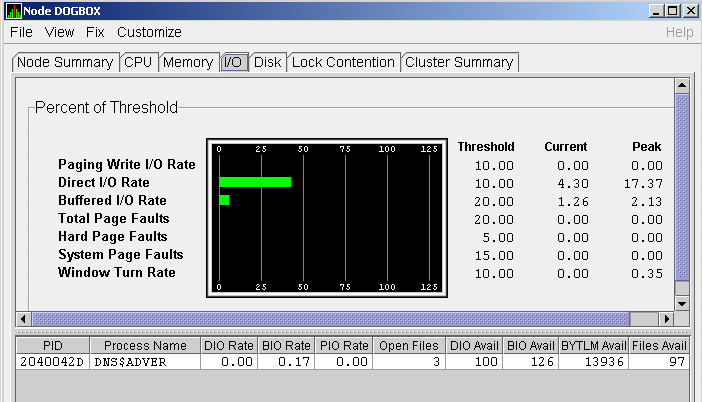
The graph in the top pane represents the percentage of thresholds for
the types of I/O shown in Table 3-7. The table also shows the event
that is related to each data item. For information about setting event
thresholds, see Section 7.8.)
Table 3-7 I/O Data Displayed
| Type of I/O |
I/O Description |
Related Event |
|
Paging Write I/O Rate
|
Rate of write I/Os to one or more paging files.
|
HIPWIO
|
|
Direct I/O Rate
|
Transfers are from the pages or pagelets containing the process buffer
that the system locks in physical memory to the system devices.
|
HIDIOR
|
|
Buffered I/O Rate
|
Transfers are for the
process buffer from an intermediate buffer from the system buffer pool.
|
HIBIOR
|
|
Total Page Faults
|
Total of hard and soft page faults on the system, as
well as peak values seen during an Availability Manager session.
|
HITTLP
|
|
Hard Page Faults
|
Total of hard page faults on the system.
|
HIHRDP
|
|
System Page Faults
|
Page faults generated by OpenVMS itself.
|
HISYSP
|
|
Window Turn Rate
|
Number of times that the file extent cache had to be refreshed.
|
WINTRN
|
Current and peak values are listed for each type of I/O.
Values that exceed thresholds set by the events indicated in the table
are displayed in red on the screen. Appendix B describes OpenVMS and
Windows events.
To the right of the graph, the following values are listed:
| Value |
Description |
|
Threshold
|
Defined in Event Configuration Properties.
|
|
Current
|
Current value or rate.
|
|
Peak
|
Highest value or rate seen since start of data collection.
|
The lower pane displays summary accumulated I/O rates on a per-process
basis. The following data is displayed:
| Data |
Description |
|
PID
|
Process identifier. A 32-bit value that uniquely identifies a process.
|
|
Process Name
|
Name of the current process.
|
|
DIO Rate
|
Direct I/O rate. The rate at which I/O transfers occur between the
system devices and the pages or pagelets that contain the process
buffer that the system locks in physical memory.
|
|
BIO Rate
|
Buffered I/O rate. The rate at which I/O transfers occur between the
process buffer and an intermediate buffer from the system buffer pool.
|
|
PIO Rate
|
Paging I/O rate. The rate of read attempts necessary to satisfy page
faults (also known as page read I/O or the hard fault rate).
|
|
Open Files
|
Number of open files.
|
|
DIO Avail
|
Direct I/O limit remaining. The number of remaining direct I/O limit
operations available before the process reaches its quota. DIOLM quota
is the maximum number of direct I/O operations a process can have
outstanding at one time.
|
|
BIO Avail
|
Buffered I/O limit remaining. The number of remaining buffered I/O
operations available before the process reaches its quota. BIOLM
quota is the maximum number of buffered I/O operations a process can
have outstanding at one time.
|
|
BYTLM
|
The number of buffered I/O bytes available before the process reaches
its quota. BYTLM is the maximum number of bytes of nonpaged system
dynamic memory that a process can claim at one time.
|
|
Files
|
Open file limit remaining. The number of additional files the process
can open before reaching its quota. The FILLM quota is the maximum
number of files that can be opened simultaneously by the process,
including active network logical links.
|
When you double-click a PID on the lower part of the I/O Summary page,
the Availability Manager displays an OpenVMS Single Process, where you can
click tabs to display specific data about one process. See
Section 3.3 for more details.
|


