HP OpenVMS Availability Manager User's Guide
3.2.4.2 OpenVMS I/O Page/Swap Files
Click I/O Page/Swap Files on the I/O page View menu to select this
option. The
Availability Manager displays an OpenVMS I/O Page/Swap Files page. The top
pane displays the same information as that in the OpenVMS I/O Summary
page (Figure 3-12). The lower pane contains the I/O Page/Swap Files
pane shown in Figure 3-13.
Figure 3-13 OpenVMS I/O Page/Swap Files

The I/O Page/Swap Files pane displays the following data:
| Data |
Description |
|
Host Name
|
Name of the node on which the page or swap file resides.
|
|
File Name
|
Name of the page or swap file. For secondary page or swap files, the
file name is obtained by a special AST to the job controller on the
remote node. The Availability Manager makes one attempt to retrieve the file
name.
|
|
Used
|
Number of used blocks in the file.
|
|
% Used
|
Of the available blocks in each file, the percentage that has been used.
|
|
Total
|
Total number of blocks in the file.
|
|
Reservable
|
The number of reservable blocks in each page or swap file currently
installed. Reservable blocks are blocks that might be logially claimed
by a process for future physical allocation. A negative value indicates
that the file might be overcommitted. Although a negative value is not
an immediate concern, it indicates that the file might become
overcommitted if physical memory becomes scarce.
|
Notes
OpenVMS Versions 7.3-1 and higher do not have a page or swap file
"Reservable" field. The Availability Manager displays N/A in
the field for these versions of OpenVMS.
If events for secondary page and swap files are signaled before the
Data Analyzer has resolved their file names from the file ID (FID),
events such as LOPGSP display the FID instead of file name information.
You can determine the file name for the FID by checking the File Name
field in the I/O Page Swap Files page. The FID for the file name is
displayed after the file name.
|
3.2.5 Disk Summaries
The Disk tab on the Node Summary page (Figure 3-4) allows you to
display disk pages that contain data about availability, count, and
errors of disk devices on the system. OpenVMS disk data displays differ
from those for Windows nodes, as described in the following sections.
On OpenVMS pages, the View menu lets you choose the following disk
summaries:
- Status Summary
- Volume Summary
Also, on the Disk Status Summary, you can double-click a device name to
display a Single Disk Summary page.
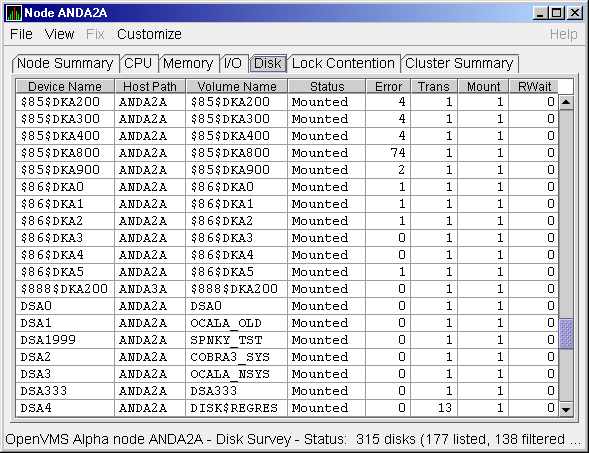
To display the default disk page, the OpenVMS Disk Status Summary page
(Figure 3-14), click the Disk tab on the OpenVMS Node Summary page
(Figure 3-4). The Disk Status Summary page displays disk device
data, including path, volume name, status, and mount, transaction,
error, and resource wait counts.
Figure 3-14 OpenVMS Disk Status Summary

This summary displays the following data:
| Heading |
Description |
|
Device Name
|
Standard OpenVMS device name that indicates where the device is
located, as well as a controller or unit designation.
|
|
Host Path
|
Primary path (node) from which the device receives commands.
|
|
Volume Name
|
Name of the mounted media.
|
|
Status
|
One or more of the following disk status values:
|
Alloc
|
Disk is allocated to a specific user.
|
|
CluTran
|
Disk status is uncertain because of a cluster state transition in
progress.
|
|
Dismount
|
Disk in process of dismounting; may be waiting for a file to close.
|
|
Foreign
|
Disk is mounted with the /FOREIGN qualifier.
|
|
Invalid
|
Disk is in an invalid state (most likely Mount Verify Timeout).
|
|
MntVerify
|
Disk is waiting for a mount verification.
|
|
Mounted
|
Disk is logically mounted by a MOUNT command.
|
|
Offline
|
Disk is no longer physically mounted in device drive.
|
|
Online
|
Disk is physically mounted in device drive.
|
|
Shadow Set Member
|
Disk is a member of a shadow set.
|
|
Unavailable
|
Disk is set to unavailable.
|
|
Wrong Volume
|
Disk was mounted with the wrong volume name.
|
|
Wrtlck
|
Disk is mounted and write locked.
|
|
|
Error
|
Number of errors generated by the disk (a quick indicator of device
problems).
|
|
Trans
|
Number of in-progress file system operations for the disk.
|
|
Mount
|
Number of nodes that have the specified disk mounted. (These nodes must
have the Data Collector installed and running to be participate in the
mount count.)
|
|
Rwait
|
Indicator that a system I/O operation is stalled, usually during normal
recovery from a connection failure or during volume processing of
host-based shadowing.
|
3.2.5.2 OpenVMS Single Disk Summary
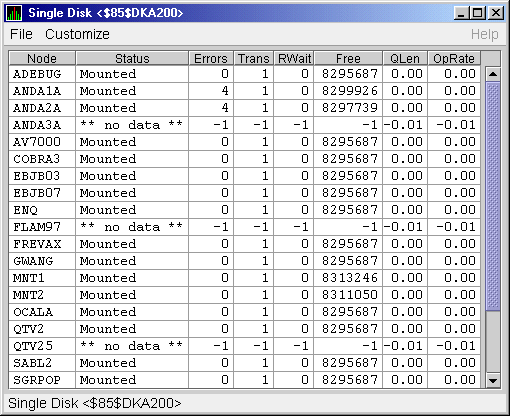
To collect single disk data and display the data on the Single Disk
Summary, double-click a device name on the Disk Status Summary.
Figure 3-15 is an example of a Single Disk Summary page. The display
interval of the data collected is 5 seconds.
Note that you can sort the order in which data is displayed in the
Single Disk Summary page by clicking a column header. To reverse the
sort order of a column of data, click the column header again.
Figure 3-15 OpenVMS Single Disk Summary

This summary displays the following data:
| Data |
Description |
|
Node
|
Name of the node.
|
|
Status
|
Status of the disk: mounted, online, offline, and so on.
|
|
Errors
|
Number of errors on the disk.
|
|
Trans
|
Number of in-progress file system operations on the disk (number of
open files on the volume).
|
|
Rwait
|
Indication of an I/O stalled on the disk.
|
|
Free
|
Number of free disk blocks on the volume.
|
|
QLen
|
Average number of operations in the I/O queue for the volume.
|
|
OpRate
|
Each node's contribution to the total operation rate (number of I/Os
per second) for the disk.
|
3.2.5.3 OpenVMS Disk Volume Summary
By using the View option on the Disk Status Summary page
(Figure 3-14), you can select the Volume Summary option to display
the OpenVMS Disk Volume Summary (Figure 3-16). This page displays
disk volume data, including path, volume name, disk block utilization,
queue length, and operation rate.
Figure 3-16 OpenVMS Disk Volume Summary

The Disk Volume Summary page displays the data described in the
following table. (The last two columns, Volume Size and Volume Limit,
are displayed only on OpenVMS Version 7.3-2 and later systems.)
| Data |
Description |
|
Device Name
|
Standard OpenVMS device name that indicates where the device is
located, as well as a controller or unit designation.
|
|
Host Path
|
Primary path (node) from which the device receives commands.
|
|
Volume Name
|
Name of the mounted media.
|
|
Used
|
Number of blocks on the volume that are in use.
|
|
% Used
|
Percentage of the number of volume blocks in use in relation to the
total volume blocks available.
|
|
Free
|
Number of blocks of volume space available for new data from the
perspective of the node that is mounted.
|
|
Queue
|
Average number of I/O operations pending for the volume (an indicator
of performance; less than 1.00 is optimal).
|
|
OpRate
|
Operation rate for the most recent sampling interval. The rate measures
the amount of activity on a volume. The optimal load is device specific.
|
|
Physical Size
|
Total number of blocks on the current physical disk device. This is the
"Total Blocks" field of the $SHOW DEVICE/FULL display
|
|
Volume Size
|
Current number of blocks available for file allocation. This is the
"Logical Volume Size" field of the $SHOW DEVICE/FULL display. (For more
information, see $SET VOLUME/SIZE.) This column is displayed only on
OpenVMS Version 7.3-2 and later systems.
|
|
Volume Limit
|
Maximum number of blocks the volume can reach using Dynamic Volume
Expansion. This is the "Expansion Size Limit" of $SHOW DEVICE/FULL
display. (For more information, see $SET VOLUME/LIMIT.) This column is
displayed only on OpenVMS Version 7.3-2 and later systems.
|
If the Availability Manager detects that a disk volume size has
increased, an VLSZCH event is signalled:
 AFFS55 Volume size of device $8$DKA200 (OPAL-X9U6) has changed
   ^                              ^          ^
  Node                          Device     Volume
  name                           name       name
|
3.2.5.4 Windows Logical and Physical Disk Summaries
On Windows nodes, the View menu lets you choose the following summaries:
- Logical Disk Summary
- Physical Disk Summary
Windows Logical Disk Summary
A logical disk is the user-definable set of partitions
under a drive letter. The Windows Logical Disk Summary displays logical
disk device data, including path, label, percentage used, free space,
and queue statistics.
To display the Logical Disk Summary page, follow these steps:
- Double-click a node name in the Node pane to display the Windows
Node Summary.
- Click the Disk tab on the Windows Node Summary.
The Availability Manager displays the Windows Logical Disk Summary page
(Figure 3-17).
Figure 3-17 Windows Logical Disk Summary

This summary displays the following data:
| Data |
Description |
|
Disk
|
Drive letter, for example,
c:, or
Total, which is the summation of statistics for all the disks.
|
|
Path
|
Primary path (node) from which the device receives commands.
|
|
Label
|
Identifying label of a volume.
|
|
Type
|
File system type; for example, FAT or NTFS.
|
|
% Used
|
Percentage of disk space used.
|
|
Free
|
Amount of free space available on the logical disk unit.
|
|
Current Queue
|
Number of requests outstanding on the disk at the time the performance
data is collected. It includes requests in progress at the time of data
collection.
|
|
Average Queue
|
Average number of both read and write requests that were queued for the
selected disk during the sample interval.
|
|
Transfers/Sec
|
Rate of read and write operations on the disk.
|
|
KBytes/Sec
|
Rate data is transferred to or from the disk during write or read
operations. The rate is displayed in kilobytes per second.
|
|
% Busy
|
Percentage of elapsed time that the selected disk drive is busy
servicing read and write requests.
|
Windows Physical Disk Summary
A physical disk is hardware used on your computer
system. The Windows Physical Disk Summary displays disk volume data,
including path, label, queue statistics, transfers, and bytes per
second.
To display the Windows Physical Disk Summary, follow these steps:
- Click the View menu on the Windows Logical Disk Summary.
- Click the Physical Disk Summary menu option.
The Availability Manager displays the Windows Physical Disk Summary
page (Figure 3-18).
Figure 3-18 Windows Physical Disk Summary

This page displays the following data:
| Data |
Description |
|
Disk
|
Drive number, for example, 0, 1, 2 or
Total, which is the summation of statistics for all the disks.
|
|
Path
|
Primary path (node) from which the device receives commands.
|
|
Current Queue
|
Number of requests outstanding on the disk at the time the performance
data is collected; it includes requests in service at the time of data
collection.
|
|
Average Queue
|
Average number of read and write requests that were queued for the
selected disk during the sample interval.
|
|
Transfers/Sec
|
Rate of read and write operations on the disk. The rate is displayed in
kilobytes per second.
|
|
KBytes/Sec
|
Rate bytes are transferred to or from the disk during read or write
operations. The rate is displayed in kilobytes per second.
|
|
% Busy
|
Percentage of elapsed time the selected disk drive is busy servicing
read and write requests.
|
|
% Read Busy
|
Percentage of elapsed time the selected disk drive is busy servicing
read requests.
|
|
% Write Busy
|
Percentage of elapsed time the selected disk drive is busy servicing
write requests.
|
3.2.6 OpenVMS Lock Contention
To display the OpenVMS Lock Contention page, click the Lock Contention
tab on the OpenVMS Node Summary page (Figure 3-4). For all the nodes
in the group you have selected, the Lock Contention page displays each
resource for which a lock contention problem might exist.
Note
Lock contention data is accurate only if every node in an OpenVMS
Cluster environment is in the same group. You might lose accuracy if
you do not have all the nodes of a cluster in one group.
|
3.2.6.1 Lock Contention Page in Decoded Format
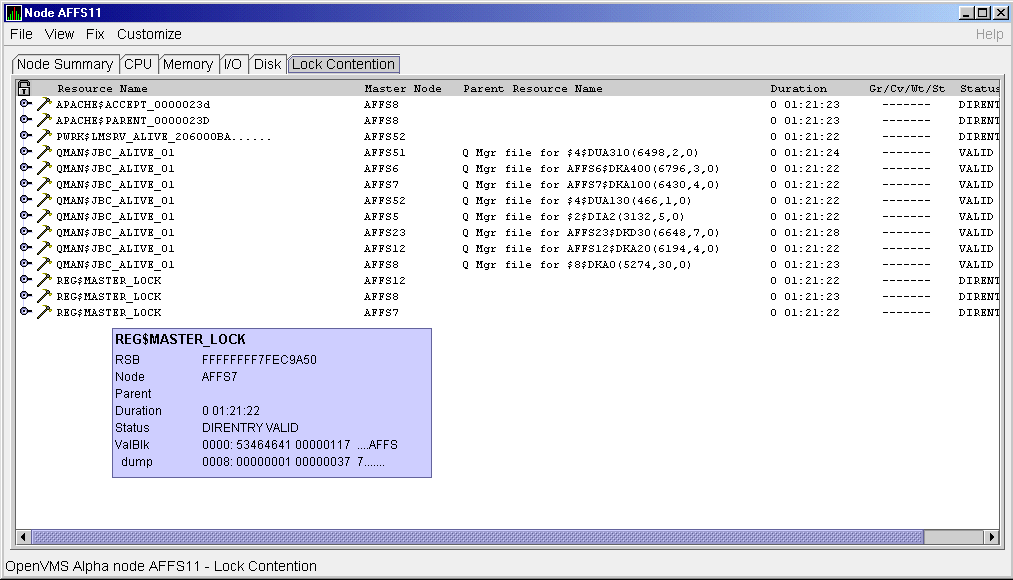
Figure 3-19 shows a sample Lock Contention page containing resource
names in decoded format, which is the default.
Figure 3-19 OpenVMS Lock Contention (Decoded Format)

(You can display a tooltip similar to the one shown in Figure 3-19 by
holding the cursor on a resource line. See the Note in the introduction
to this chapter for further details.)
By selecting the View menu (on the Lock Contention page), followed by
the Resource names menu item, you can choose to display the resource
name and parent resource name in either of two formats:
- Raw format (the format that SDA uses)
- Decoded format (the default format)
Figure 3-19 displays the resource names in decoded format. (The
Availability Manager decodes common resource names.)
The Lock Contention page displays the data described in Table 3-8.
Numbered lines correspond to lines or items of data in the Lock
Contention Log (Example 3-1).
Table 3-8 Data on the OpenVMS Lock Contention Page
| Lock Log Reference Number |
Data |
Description |
|
1
|
Resource Name
|
Resource name associated with the $ENQ system service call.
|
|
2
|
Master Node
|
Node on which the resource is mastered.
|
|
3
|
Parent Resource
|
Name of the parent resource. No name is displayed when a parent
resource does not exist.
|
|
4
|
Duration
|
Time elapsed since the Availability Manager first detected the
contention situation.
|
|
5
|
Gr/Cv/Wt/St
|
Total number of locks in each of four states. Numbers for these states
appear only when you are collecting lock data. The states are:
- Granted
- Converting
- Waiting
- Stalled
Stalled indicates one of several states whenever a lock is
waiting for a response from another node in the cluster.
|
|
6
|
Status
|
Status of the lock. See the $ENQW description of flags in the
HP OpenVMS System Services Reference Manual.
|
The tooltip that is displayed when you hold the cursor over a line of
data in Figure 3-19 contains the data described in Table 3-8, as
well as the information described in Table 3-9.
3.2.6.2 Lock Contention Page in Raw Format
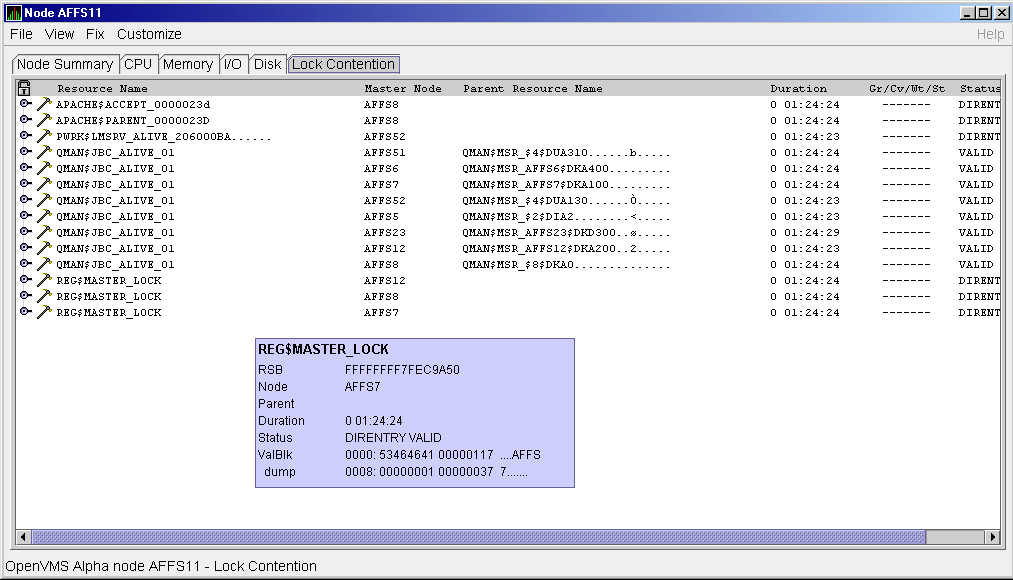
Figure 3-20 shows the Lock Contention page with resource name data
displayed in raw format. It also shows the tooltip that is displayed
when you hold the cursor over a line of data.
Figure 3-20 OpenVMS Lock Contention (Raw Format)

In Figure 3-20, notice that a period is substituted for each
unprintable character in the Resource Name and Parent Resource Name
fields.
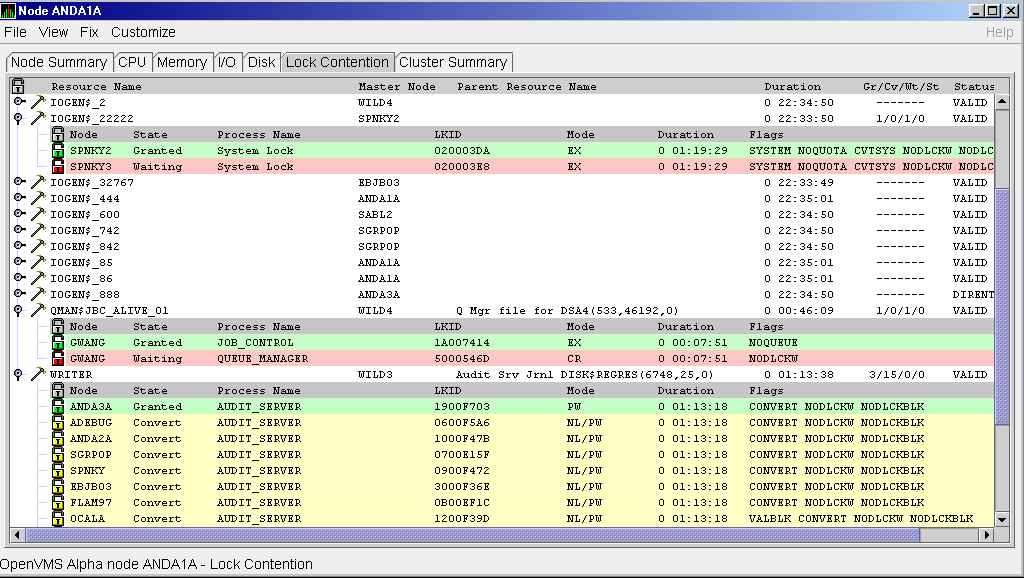
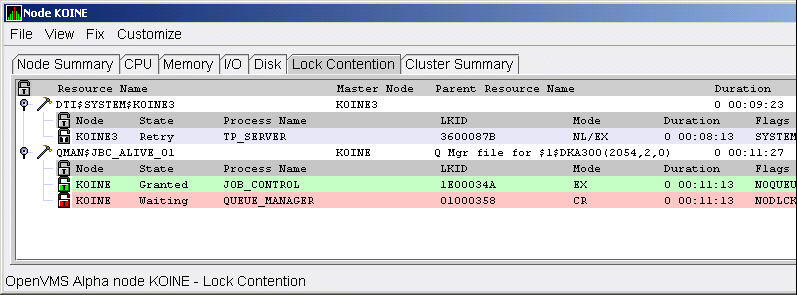
When you click the handle that precedes any line of resource data, the
Availability Manager displays the lock block data that is shown in
Figure 3-21 and Figure 3-22.
Figure 3-21 OpenVMS Lock Block Data

Figure 3-22 OpenVMS Lock Block Data (Retry Stalled
State)

The lock block data in these two figures includes additional lock
information under the headings shown in Table 3-10. Numbered lines
correspond to lines or items of data in the Lock Contention Log
(Example 3-1).
Table 3-10 Lock Block Data
| Reference Number |
Data |
Description |
|
9
|
Node
|
Node name on which the lock is granted.
|
|
10
|
State
|
One of the following:
| Color |
Meaning |
|
Green
|
Granted
|
|
Yellow
|
Converting
|
|
Pink
|
Waiting
|
|
Pale grey
|
Stalled states that are visible:
SCSWAIT: A transient state indicating that a lock message has been
sent to the node with the master lock and a response is awaited.
RETRY: A transient state seen only under error conditions that
require that a lock message be resent. This can occur if the node to
which a lock message was sent goes down before a response from it is
received or if resources for sending a message cannot be allocated.
|
|
|
11
|
Process Name
|
Name of the process that owns the blocking lock.
|
|
12
|
LKID
|
Lock ID value (which is useful with SDA).
|
|
13
|
Mode
|
One of the following modes in which the lock is granted or requested:
1
|
CR
|
Concurrent read
|
Grants read access and allows resource sharing with other readers and
writers.
|
|
CW
|
Concurrent write
|
Grants write access and allows resource sharing with other groups.
|
|
EX
|
Exclusive
|
Grants write access and prevents resource sharing with any other
readers or writers.
|
|
NL
|
Null
|
Grants no access; used as an indicator of interest or a placeholder for
future lock conversion.
|
|
PR
|
Protected read
|
Grants read access and allows resource sharing with other readers, but
not writers.
|
|
PW
|
Protected write
|
Grants write access and prevents resource sharing with any other
readers or writers.
|
If one mode is displayed, it is the Granted mode; if two modes are displayed, the first is the Granted mode and the second is the Converting mode.
|
|
14
|
Duration
|
Length of time the lock has been in the current queue since the console
application found the lock.
|
|
15
|
Flags
|
Flags specified with the $ENQW request. See the $ENQW entry in
HP OpenVMS System Services Reference Manual.
|
1Descriptions are from Goldenberg, Ruth, and Saravanan,
Saro, OpenVMS AXP Internals and Data Structures, Version 1.5,
Digital Press, 1994.
|

