 |
HP OpenVMS Availability Manager User's Guide
To interpret the information displayed on the OpenVMS Lock Contention
page, you need to understand OpenVMS lock management services. For more
information, see the HP OpenVMS System Services Reference Manual.
Example 3-1 contains an excerpt of a lock block log file. You can
find a lock block log file in either of the following locations:
| System |
File Name |
Location |
|
Windows
|
AvailManLock.log
|
Installation directory
|
|
OpenVMS
|
AvailManLock.log, prefaced by AMDS$AM_LOG
|
Directory to which AMDS$AM_LOG logical points
|
Numbers preceding lines or items of data in Example 3-1 correspond to
numbered lines in Table 3-8, Table 3-9, and Section 3.2.6.3.
Table 3-11 contains lines or items of data in a lock block log file
that are not described in the other tables in this section.
Table 3-11 Additional Data in the Lock Block Log File
| Lock Log Reference Number |
Data from Example |
Description |
|
16
|
Reason for logging
|
In the example, the reason for logging is "the number of locks has
changed." Other reasons include the "initial discovery of resource
contention" or "lock data collection has been turned on."
|
|
17
|
GGMODE/CGMODE
|
Lock has been Granted/Lock is Converting.
|
|
18
|
Resource Name Dump
|
OpenVMS style of Resource Name dump.
|
|
19
|
RDB global database name resource
|
Decoded Resource Name.
|
|
20
|
Parent Resource Name Dump
|
OpenVMS style of Parent Resource Name dump.
|
|
21
|
RDB global database name resource
|
Decoded Parent Resource Name.
|
|
22
|
Lock data is being collected
|
The handle preceding a line of lock data has been turned.
|
|
23
|
Master copy info. Remote Node
|
Remote node that contains the master copy of the lock. If "Local
Copy," only one node is interested in the lock.
|
|
24
|
Master copy info. Remote Lock ID
|
Lock ID of remote node that contains the master copy of the lock.
|
| Example 3-1 Lock Block Log File |
**************************************************
Time:  11-Nov-2003 14:54:13.656

16)Reason for logging:    Number of locks has changed

2) Master Lock Node:      ALTOS

1) Resource Name:         I.....
17)    GGMODE/CGMODE:     EX/EX
6)     Status:            VALID
7)     RSB Address:       FFFFFFFE.889F1580
18)    Resource Name Dump (includes initial count byte):
          0000:   000200 00004906  .I.....

8)     Value Block Dump:
          0000: 00000000 00000000  ........
          0008: 00000000 00000000  ........

19) Rdb Remote monitor resource
          #:                 2

3) Parent Resource Name:  Ý...D....VDEROOT     . 7....
7)     RSB Address:       FFFFFFFE.8847DB80
20)    Resource Name Dump (includes initial count byte):
          0000: 00004400 0000DD1C  .....D..
          0008: 4F4F5245 44560200  ..VDEROO
          0010: A0002020 20202054  T     ..
          0018:       00 00000237  7....

8)     Value Block Dump:
          0000: 00000000 00000000  ........
          0008: 00000000 00000000  ........

21)    Rdb global database name resource
          Disk volume name:  VDEROOT
          FID for file:      (14240,2,0)

22) Lock data is being collected

5)     Granted lock count:       1
5)     Conversion lock count:    0
5)     Waiting lock count:       4
5)     Stalled lock count:       0

       10)      9)               11)           12)      13) Master copy info:   15)
      Lock     Node   Process  Process         Lock    Gr/Cv Remote Remote   Flags
      State           PID      Name            ID       Mode Node   Lock ID
                                                              23)    24)
      Granted  ALTOS  28E00441 RDMS_MONITOR70  04014B37 EX    (Local copy)      NQUE SYNC SYS
      Waiting  ALTOS  2880023F RDMS_MONITOR70  4C0065B5 PR   TSAVO  32005001      SYNC SYS  NDLW
      Waiting  ALTOS  00000000 (EPID=28A0023D) 4C0144C4 PR   ETOSHA 74005E36      SYNC SYS  NDLW
      Waiting  ALTOS  28C00448 RDMS_MONITOR70  1D0144A3 PR   CHOBE  77005906      SYNC SYS  NDLW
      Waiting  ALTOS  28E026C3 VDE$KEPT126A3   01014B2D PR    (Local copy)             SYS  NDLW

**************************************************
|
3.3 OpenVMS Single Process Data
When you double-click a row in the lower part of an OpenVMS Mode
Details (Figure 3-7), OpenVMS CPU Process Summary (Figure 3-8),
Memory (Figure 3-10), or I/O (Figure 3-12) pages, the Availability Manager
displays the first of several OpenVMS Single Process pages.
Alternatively, you can right-click a row and select
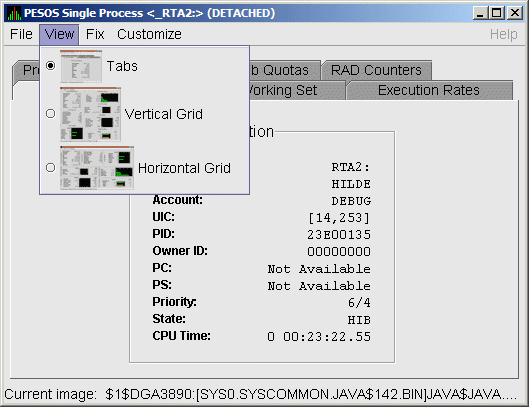
"Display...". The "View" menu item contains three
display options, shown in Figure 3-23.
Figure 3-23 Single Process Window

Explanations of the choices in the "View" menu are the
following:
- Tabs: individual tabs for each Single Process display:
- Process Information
- Working Set
- Execution Rates
- Process Quotas
- Wait States
- Job Quotas
- RAD Counters
- Vertical Grid: all of the Single Process displays combined in one
vertically-oriented grid
- Horizontal Grid: all of the Single Process displays combined in one
horizontally-oriented grid
The following sections describe the individual tabs or sections of the
vertical or horizontal grids.
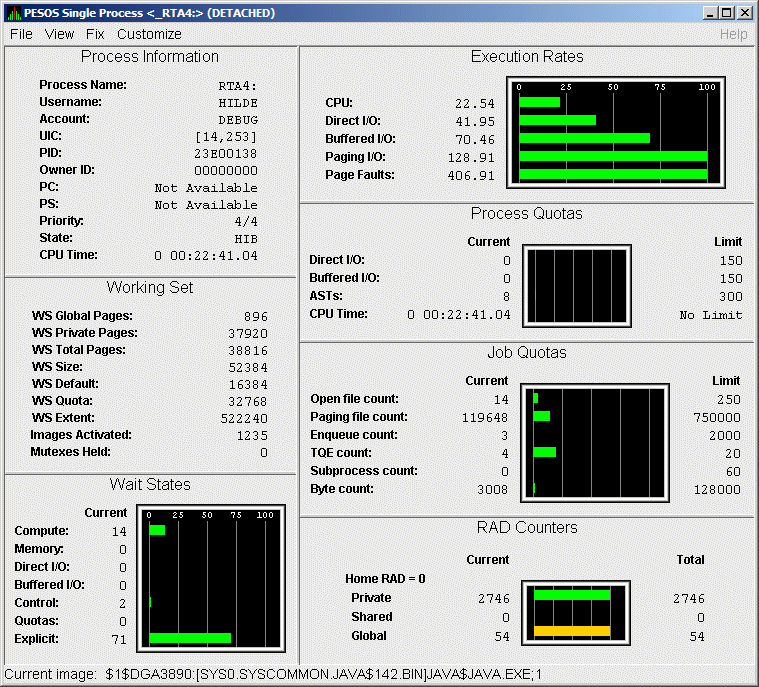
Each section refers to the vertical grid display shown in Figure 3-24.
Figure 3-24 Single Process Vertical Grid Display

3.3.1 Process Information
Table 3-12 describes the Process Information data shown in
Figure 3-24.
The data on this page is displayed at the default intervals shown for
Single Process Data on the Data Collection Customization page.
Table 3-12 Process Information
| Data |
Description |
|
Process name
|
Name of the process.
|
|
Username
|
User name of the user who owns the process.
|
|
Account
|
Account string that the system manager assigns to the user.
|
|
UIC
|
User identification code (UIC). A pair of numbers or character strings
that designate the group and user.
|
|
PID
|
Process identifier. A 32-bit value that uniquely identifies a process.
|
|
Owner ID
|
Process identifier of the process that created the process displayed on
the page. If the PID is 0, then the process is a parent process.
|
|
PC
|
Program counter.
On OpenVMS Alpha systems, this value is displayed as 0 because the
data is not readily available to the Data Collector node.
|
|
PS
|
Processor status longword (PSL). This value is displayed on VAX systems
only.
|
|
Priority
|
Computable and base priority of the process. Priority is an integer
between 0 and 31. Processes with higher priority are given more CPU
time.
|
|
State
|
One of the process states listed in Appendix A.
|
|
CPU Time
|
CPU time used by the process.
|
3.3.2 Working Set
Table 3-13 describes the Working Set data shown in Figure 3-24.
Table 3-13 Working Set
| Data |
Description |
|
WS Global Pages
|
Shared data or code between processes, listed in pages (measured in
pagelets).
|
|
WS Private Pages
|
Amount of accessible memory, listed in pages (measured in pagelets).
|
|
WS Total Pages
|
Sum of global and private pages (measured in pagelets).
|
|
WS Size
|
Working set size. The number of pages (measured in pagelets) of memory
the process is allowed to use. This value is periodically adjusted by
the operating system based on analysis of page faults relative to CPU
time used. Increases in large units indicates that a process is taking
many page faults, and its memory allocation is increasing.
|
|
WS Default
|
Working set default. The initial limit of the number of physical pages
(measured in pagelets) of memory the process can use. This parameter is
listed in the user authorization file (UAF); discrepancies between the
UAF value and the displayed value are due to page/longword boundary
rounding or other adjustments made by the operating system.
|
|
WS Quota
|
Working set quota. The maximum amount of physical pages (measured in
pagelets) of memory the process can lock into its working set. This
parameter is listed in the UAF; discrepancies between the UAF value and
the displayed value are due to page/longword boundary rounding or other
adjustments made by the operating system.
|
|
WS Extent
|
Working set extent. The maximum number of physical pages (measured in
pagelets) of memory the system will allocate for the process. The
system provides memory to a process beyond its quota only when it has
an excess of free pages and can be recalled if necessary. This
parameter is listed in the UAF; any discrepancies between the UAF value
and the displayed value are due to page/longword boundary rounding or
other adjustments made by the operating system.
|
|
Images Activated
|
Number of times an image is activated.
|
|
Mutexes Held
|
Number of mutual exclusions (mutexes) held. Persistent values other
than zero (0) require analysis. A mutex is similar to a lock but is
restricted to one CPU. When a process holds a mutex, its priority is
temporarily increased to 16.
|
3.3.3 Execution Rates
Table 3-14 describes the Execution Rates data shown in
Figure 3-24.
Table 3-14 Execution Rates
| Data |
Description |
|
CPU
|
Percent of CPU time used by this process. The ratio of CPU time to
elapsed time.
|
|
Direct I/O
|
Rate at which I/O transfers take place from the pages or pagelets
containing the process buffer that the system locks in physical memory
to the system devices.
|
|
Buffered I/O
|
Rate at which I/O transfers take place for the process buffer from an
intermediate buffer from the system buffer pool.
|
|
Paging I/O
|
Rate of read attempts necessary to satisfy page faults. This is also
known as page read I/O or the hard fault rate.
|
|
Page Faults
|
Page faults per second for the process.
|
3.3.4 Quotas
Table 3-15 describes the Process Quotas data shown in Figure 3-24.
Note that when you display the SWAPPER process, no values are listed in
this section. The SWAPPER process does not have quotas defined in the
same way as other system and user processes do.
Table 3-15 Quotas
| Data |
Description |
|
Direct I/O
|
The current number of direct I/Os used compared with the limit possible.
|
|
Buffered I/O
|
The current number of buffered I/Os used compared with the possible
limit.
|
|
ASTs
|
Asynchronous system traps. The current number of ASTs used compared
with the possible limit.
|
|
CPU Time
|
Amount of time used compared with the possible limit. "No Limit" is
displayed if the limit is zero.
|
3.3.5 Wait States
Table 3-16 describes the Wait States data shown in Figure 3-24.
In the graph, "Current" refers to the percentage of elapsed
time each process spends in one of the computed wait states. If a
process spends all its time waiting in one state, the total gradually
reaches 100%.
How Wait States are Calculated
The wait state specifies why a process cannot execute, based on
calculations made on collected data. Each value is calculated over an
entire data collection period of approximately 2 minutes. The graph
shows, over this period of time, the percentage of time a process
spends in each wait state. Each value is an exponential average that
approximates a moving average. A more detailed explanation follows.
When monitoring of a single process starts, all wait state values are
zero. When the system periodically checks the process, the system first
subtracts 10% from each value. It then adds a value of 10 to the wait
state the process is currently in, if any.
For example, at the start, if a process is found to be in the Control
wait state, the graph immediately registers 10 for Control. If the
process is still in the Control wait state the next time it is checked,
the graph shows Control at 19. This value is 90% of the original 10 (or
9), plus 10 (the value currently being added).
The next time the process is checked, if it is found to be in the
Buffered I/O wait state, Buffered I/O is set to 10 and Control is set
to 17 (approximately 90% of the previous value of 19).
The following time the process is checked, if it is not in a wait state
at all, Buffered I/O is set to 9 (90% of 10), and Control is set to 15
(90% of 17).
Appendix A contains descriptions of wait states.
Table 3-16 Wait States
| Data |
Description |
|
Compute
|
Average percentage of time that the process is waiting for CPU time.
Possible states are COM, COMO, or RWCAP.
|
|
Memory
|
Average percentage of time that the process is waiting for a page fault
that requires data to be read from disk; this is common during image
activation. Possible states are PFW, MWAIT, COLPG, FPG, RWPAG, RWNPG,
RWMPE, or RWMPB.
|
|
Direct I/O
|
Average percentage of time that the process waits for data to be read
from or written to a disk or tape. The possible state is DIO.
|
|
Buffered I/O
|
Average percentage of time that the process waits for data to be read
from or written to a slower device such as a terminal, line printer,
mailbox, or network traffic. The possible state is BIO.
|
|
Control
|
Average percentage of time that the process is waiting for another
process to release control of some resource. Possible states are CEF,
MWAIT, LEF, LEFO, RWAST, RWMBX, RWSCS, RWCLU, RWCSV, RWUNK, or LEF
waiting for an ENQ.
|
|
Quotas
|
Average percentage of time that the process is waiting because the
process has exceeded some quota. Possible states are QUOTA or
RWAST_QUOTA.
|
|
Explicit
|
Average percentage of time that the process is waiting because the
process asked to wait, such as a hibernate system service. Possible
states are HIB, HIBO, SUSP, SUSPO, or LEF waiting for a TQE.
|
3.3.6 Job Quotas
Table 3-17 describes the Job Quota data shown in Figure 3-24.
Table 3-17 Job Quotas
| Data |
Description |
AUTHORIZE Quota |
|
Open File Count
|
Current number of open files compared with the possible limit.
|
FILLM
|
|
Paging File Count
|
Current number of disk blocks in the page file that the process can use
compared with the possible limit.
|
PGFLQUOTA
|
|
Enqueue Count
|
Current number of resources (lock blocks) queued compared with the
possible limit.
|
ENQLM
|
|
TQE Count
|
Current number of timer queue entry (TQE) requests compared with the
possible limit.
|
TQELM
|
|
Subprocess Count
|
Current number of subprocesses created compared with the possible limit.
|
PRCLM
|
|
Byte Count
|
Current number of bytes used for buffered I/O transfers compared with
the possible limit.
|
BYTLM
|
3.3.7 RAD Counters
Table 3-18 describes the RAD Counters data shown in Figure 3-24.
The RAD (Resource Affinity Domain) Counters data page is displayed for
Alpha and I64 systems.
Table 3-18 RAD Counters Data
| Data |
Description |
|
Private
|
Number of process private pages on RAD 0.
|
|
Shared
|
Number of process shared pages on RAD 0.
|
|
Global
|
Number of global pages on RAD 0.
|
|

