Software > OpenVMS Systems > Documentation > 83final > 6552 HP OpenVMS Systems Documentation |
HP OpenVMS Availability Manager User's Guide
7.1.1 Recognizing Levels of CustomizationThe customization levels for various Availability Manager values are displayed as icons on some pages. The OpenVMS Data Collection Customization page (Figure 7-1) displays several of these icons. Figure 7-1 OpenVMS Data Collection Customization 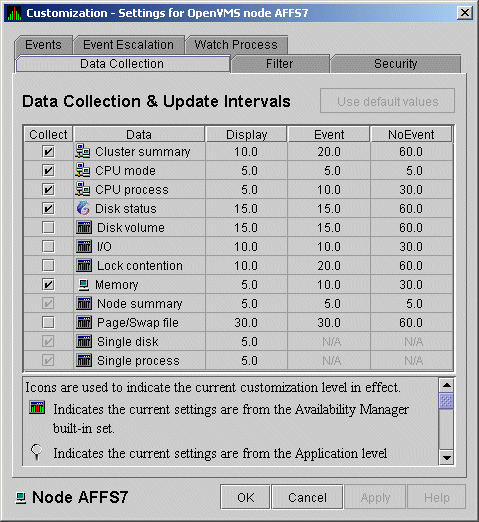
The icons preceding each data item in Figure 7-1 indicate the current customization level for each collection choice. Table 7-2 describes these icons and tells where each appears in Figure 7-1.
7.1.2 Setting Levels of CustomizationWhen you customize values, the Availability Manager keeps track of the next higher level of each value. This means that you can reset a value to the value set at the next higher level. To return to the values set at the preceding level, click the Use default values button at the top of a customization page. The icon on the "Use default values" button and explanation at the bottom of the page indicate the previous customization level. In the main System Overview window (see Figure 2-1), you can select the customization levels that are shown in Table 7-1. The following sections explain levels of customization in more detail. 7.1.3 Knowing the Number of Nodes Affected by Each Customization LevelAnother way of looking at Availability Manager customization is to consider the number of nodes affected by each level of customization. Depending on which customization menu you use and your choice of menu items, your customizations can affect one or more nodes, as indicated in the following table.
7.2 Customizing Settings at the Application and Operating System LevelsIn the System Overview window menu bar, select Customize. The Availability Manager displays the shortcut menu shown in Figure 7-2. Figure 7-2 Application and Operating System Customization Menu 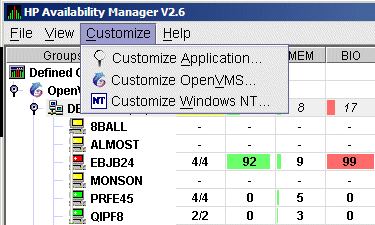
7.2.1 Customizing Application SettingsWhen you select Customize Application..., by default the Availability Manager displays the Group/Nodes Lists page (Figure 7-3), where the Inclusion lists tab is the default.
7.2.1.1 Application Settings---Groups/Nodes Inclusion PageOn the Groups/Nodes Inclusion page (Figure 7-3) you can select groups of nodes or individual nodes to be displayed. Figure 7-3 Application Settings---Groups/Nodes Inclusion 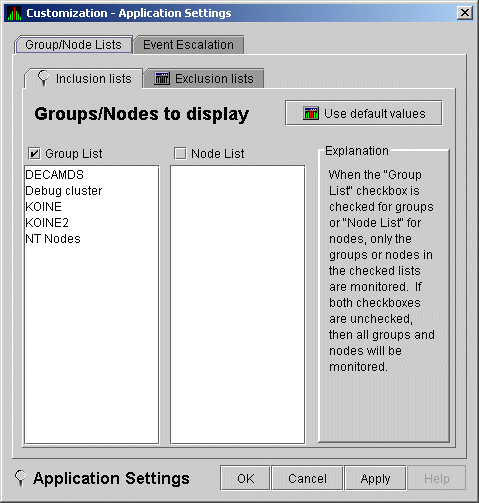
On the Groups/Nodes Inclusion page, you have the following choices:
If you decide to return to the default (Group List: DECAMDS) or to enter names again, select Use default values. After you enter a list of nodes or groups of nodes, click one of the following buttons at the bottom of the page:
If nodes were previously selected for monitoring, their names are not removed from the display even if you click OK or Apply. They are filtered out the next time the Availability Manager is started. 7.2.1.2 Application Settings---Groups/Nodes Exclusion ListsAs an alternative to the Inclusion lists on the Groups/Nodes Inclusion page, you can click the Exclusion lists tab in Figure 7-4, where you can select groups of nodes or individual nodes to be excluded from display. Figure 7-4 Application Settings---Groups/Nodes Exclusion Lists 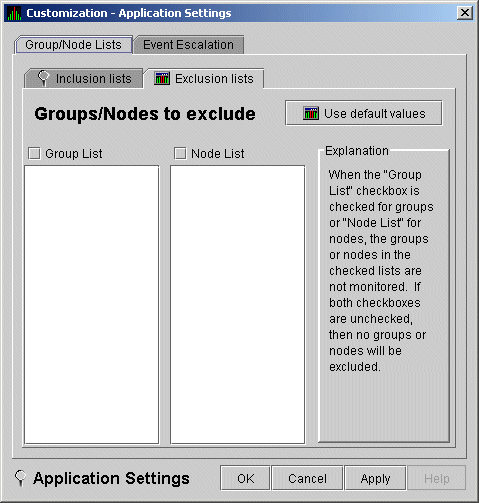
On the Groups/Nodes Exclusion Lists page, you have the following choices:
After you enter a list of nodes or groups of nodes, click one of the buttons at the bottom of the page:
If nodes were previously selected for monitoring, their names are not removed from the display even if you click OK or Apply to exclude them from monitoring. 7.2.2 Customizing Windows Operating System SettingsWhen you select Customize Windows NT..., the Availability Manager displays a page similar to the one shown in Figure 7-5. Figure 7-5 Windows Operating System Customization 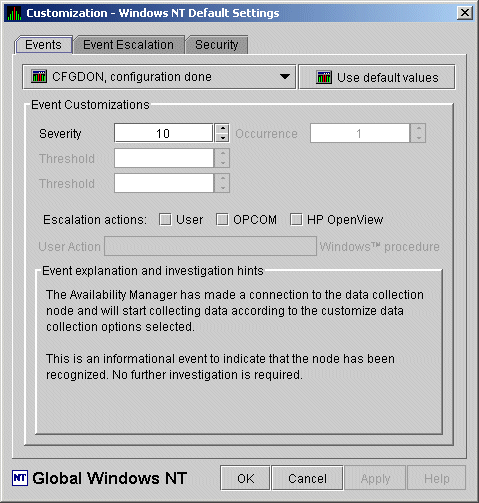
The default page displayed is the Event Customization page. Instructions for using this page are in Section 7.8.1. The other tabs displayed are the Event Escalation page, which is explained in Section 7.7, and the Windows Security Customization page, which is explained in Section 7.9.2.2. 7.2.3 Customizing OpenVMS Operating System SettingsWhen you select Customize OpenVMS..., the Availability Manager displays the page shown in Figure 7-6, which contains tabs for the last 6 types of customization listed in Table 7-1. (Instructions for making these types of customizations are later in this chapter, beginning in Section 7.5.) Figure 7-6 OpenVMS Operating System Customization 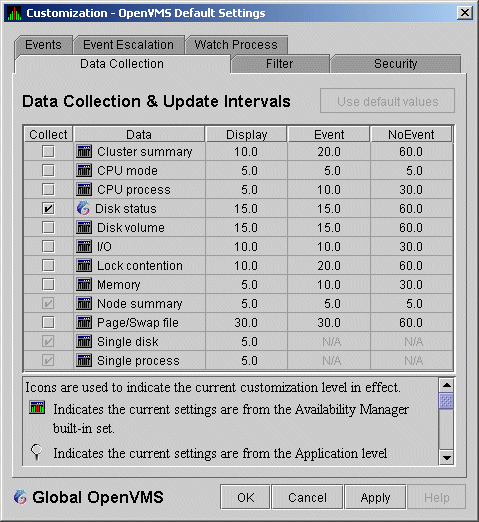
7.3 Customizing Settings at the Group LevelTo perform customizations at the group level, right-click a group name in the System Overview window. The Availability Manager displays a small menu similar to the one shown in Figure 7-7. Figure 7-7 Group Customization Menu 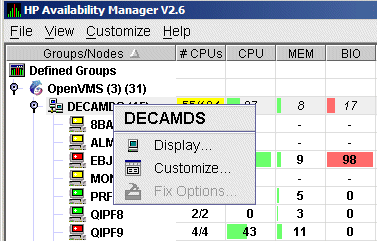
When you select Customize, the Availability Manager displays a page similar to the one shown in Figure 7-6. 7.4 Customizing Settings at the Node LevelTo customize a specific node, do either of the following:
Figure 7-8 Node Customization Menu 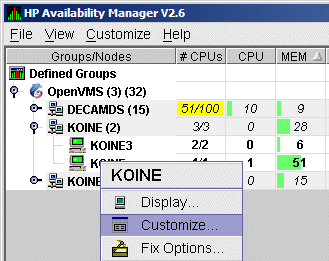
When you select Customize, the Availability Manager displays a customization page similar to the one shown in Figure 7-6. 7.4.1 Changing the Group of an OpenVMS NodeEach Availability Manager Data Collector node is assigned to the DECAMDS group by default.
You need to edit a logical on each Data Collector node to change the group for that node. To do this, follow these steps:
7.4.2 Changing the Group of a Windows Node
You need to edit the Registry to change the group of a Windows node. To edit the Registry, follow these steps:
7.5 Customizing OpenVMS Data Collection
When you choose the Customize OpenVMS menu option in the System Overview window (see Figure 7-2), by default the Availability Manager displays the OpenVMS Data Collection Customization page (Figure 7-9) where you can select types of data you want to collect for all of the OpenVMS nodes you are currently monitoring. You can also change the default Availability Manager intervals at which data is collected or updated. Figure 7-9 OpenVMS Data Collection Customization 
Table 7-3 identifies the page on which each type of data collected and displayed in Figure 7-9 appears and indicates whether or not background data collection is turned on for that type of data collection. See Chapter 1 for information about background data collection. (You can also customize data collection at the group and node levels, as explained in Section 7.1.)
1Data is collected by default when you open a Single Disk Summary page. 2Data is collected by default when you open a Single Process page. You can choose additional types of background data collection by selecting the Collect check box for each one on the Data Collection Customization page of the Customize OpenVMS... menu (Figure 7-6). A check mark indicates that data is to be collected at the intervals described in Table 7-4.
You can enter a different collection interval by selecting a row of data and selecting a value. Then delete the old value and enter a new one. If you change your mind and decide to return to the default collection interval, select one or more rows of data items: then select Use default values. The system displays the default values for all the collection intervals. When you finish customizing your data collection, click one of the following buttons at the bottom of the page:
7.6 Customizing OpenVMS Data FiltersWhen you choose "Customize" at the operating system, group, or node level and then select the Filter tab, the Availability Manager displays pages that allow you to customize data (see Figure 7-10). The types of data filters available are the following:
Filters can vary depending on the type of data collected. For example, filters might be process states or a variety of rates and counts. The following sections describe data filters that are available for various types of data collection. You can also customize filters at the group and node levels (see Section 7.1). Keep in mind that the customizations that you make at the various levels override the ones set at the previous level (see Table 7-1). The icons preceding each data item (see Table 7-2) indicate the level at which the data item was customized. In Figure 7-10, for example, the icon preceding "CPU" indicates that the current setting comes from the AM Defaults. If you change your mind and decide to return to filter values set at the previous level, select Use default values. The icon appearing on the button indicates the level of the previous values. In Figure 7-10, for example, the previous value is the AM Defaults value. When you finish modifying filters on a page, click one of the following buttons at the bottom of the page:
|