[an error occurred while processing this directive]

HP OpenVMS Systems Documentation

Content starts here

OpenVMS Debugger Manual


Previous Contents Index

8.3 Entering Commands at the Prompt

The debugger's HP DECwindows Motif for OpenVMS GUI is layered on the command interface. The command line, the last line in the command view and identified by the command-entry prompt (DBG„), lets you enter debugger commands for the following purposes:

  • As an alternative to using the HP DECwindows Motif for OpenVMS GUI menus and push buttons for certain operations
  • To do debugging tasks not available through the HP DECwindows Motif for OpenVMS GUI pull-down menus and push buttons

Figure 8-9 shows the RUN command in the command view.

Figure 8-9 Entering Commands at the Prompt


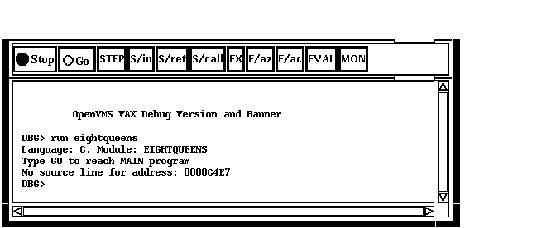
When you use the HP DECwindows Motif for OpenVMS interface pull-down menus and push buttons, the debugger translates your input into debugger commands and echoes these commands on the command line so that you have a record of your commands. Echoed commands are visually indistinguishable from commands that you enter explicitly on the command line.

For information about the debugger's command interface, see Part 2. For online help about the commands, see Section 8.4.3.

In addition to entering debugger commands interactively at the prompt, you can also place them in debugger initialization files and command files for execution within the HP DECwindows Motif for OpenVMS environment.

You can also take advantage of the keypad support available at the command-entry prompt. (This support is a subset of the more extensive keypad support provided for the command interface, which is described in Appendix A.) The commands in Table 8-6 are mapped to individual keys on your computer keypad.

Table 8-6 Keypad Definitions in the HP DECwindows Motif for OpenVMS Debugger Interface
Command Corresponding Key
Step/Line KP0
Step/Into GOLD-KP0
Step/Over BLUE-KP0
Examine KP1
Examine^ GOLD-KP1
Go KP,
Show Calls KP5
Show Calls 3 GOLD-KP5

To enter one of these commands, press the key or keys indicated, followed by the Enter key on the keypad. (The GOLD key is PF1; the BLUE key is PF4.)

For information on changing these key bindings, or binding commands to unassigned keys on the keypad, see Section 10.10.4.4.

8.3.1 Debugger Commands That Are Not Available in the HP DECwindows Motif for OpenVMS Interface

Table 8-7 lists the debugger commands that are disabled in the debugger's HP DECwindows Motif for OpenVMS interface. Many of them are relevant only to the debugger's screen mode.

Table 8-7 Debugger Commands Not Available in the HP DECwindows Motif for OpenVMS User Interface
ATTACH SELECT
CANCEL MODE (SET,SHOW) ABORT_KEY
CANCEL WINDOW (SET,SHOW) KEY
DEFINE/KEY (SET,SHOW) MARGINS
DELETE/KEY SET MODE [NO]KEYPAD
DISPLAY SET MODE [NO]SCREEN
EXAMINE/SOURCE SET MODE [NO]SCROLL
EXPAND SET OUTPUT [NO]TERMINAL
EXTRACT (SET,SHOW) TERMINAL
HELP 1 (SET,SHOW) WINDOW
MOVE (SET,CANCEL) DISPLAY
SAVE SHOW SELECT
SCROLL SPAWN

1Help on commands is available from the Help menu in a debugger window.

The debugger issues an error message if you enter any of these commands on the command line, or if the debugger encounters one of these commands while executing a command procedure.

8.4 Displaying Online Help About the Debugger

The following types of online help about the debugger and debugging are available during a debugging session:

  • Context-sensitive help---information about an area or object in a window or dialog box
  • Task-oriented help---consists of an introductory help topic named Overview of the Debugger and several subtopics on specific debugging tasks
  • Help on debugger commands and various topics, such as language support
  • Help on debugger diagnostic messages

Task-oriented topics related to context-sensitive topics are connected through the list of additional topics in the help windows.

8.4.1 Displaying Context-Sensitive Help

Context-sensitive help is information about an area or object in a window or a dialog box.

To display context-sensitive help:

  1. Choose On Context from the Help menu in a debugger window. The pointer shape changes to a question mark (?).
  2. Place the question mark on an object or area in a debugger window or dialog box.
  3. Click MB1. Help for that area or object is displayed in a Help window. Additional topics provide task-oriented discussions, where applicable.

To display context-sensitive help for a dialog box, you can also click on the Help button in the dialog box.

Notes

Chapter 12, which is organized by task, explains how to use the debugger's Heap Analyzer.

You cannot obtain true context-sensitive help about any push button other than Stop. This is because all other buttons can be modified or removed.

8.4.2 Displaying the Overview Help Topic and Subtopic

The Overview help topic (Overview of the Debugger) and its subtopics provide task-oriented information about the debugger and debugging.

To display the Overview topic, use either of these techniques:

  • Choose On Window from the Help menu in a debugger window.
  • Choose Go To Overview from the View menu of a debugger help window.

To display information about a particular topic, choose it from the list of additional topics.

8.4.3 Displaying Help on Debugger Commands

To display help on debugger commands:

  1. Choose On Commands from the Help menu of a debugger window.
  2. Choose the command name or other topic (for example, Language_Support) from the list of additional topics.

Note that the Help command is not available through the command line interface in the command view.

8.4.4 Displaying Help on Debugger Diagnostic Messages

Debugger diagnostic messages are displayed in the command view. To display help on a particular message:

  1. Choose On Commands from the Help menu of a debugger window.
  2. Choose Messages from the list of additional topics.
  3. Choose the message identifier from the list of additional topics.


Chapter 9
Starting and Ending a Debugging Session

This chapter explains how to:

  • Start the debugger ( Section 9.1)
  • Continue when your program completes execution ( Section 9.2)
  • Rerun the same program from the current debugging session ( Section 9.3)
  • Run another program from the current debugging session ( Section 9.4)
  • Interrupt program execution and debugger operations ( Section 9.6)
  • End a debugging session ( Section 9.7)
  • Start the debugger in additional ways for specific purposes ( Section 9.8)
  • Debug a program already running in a subprocess or detached process ( Section 9.5)

9.1 Starting the Kept Debugger

This section explains the most common way to start the debugger from DCL level ($) and bring your program under debugger control. Section 9.8 explains optional ways to start the debugger.

Starting the kept debugger as explained here enables you to use the Connect (see Section 9.5), Rerun (see Section 9.3), and Run (see Section 9.4) features.

To start the debugger and bring your program under debugger control:

  1. Verify that you have compiled and linked the program as explained in Section 1.2.
  2. Enter the following command line:


    $ DEBUG/KEEP
    

    By default, the debugger starts up as shown in Figure 9-1. The main window remains empty until you bring a program under debugger control (Step 4). Upon startup, the debugger executes any user-defined initialization file (see Section 13.2).

    Figure 9-1 Debugger at Startup


  3. Bring your program under debugger control using one of the following three techniques:
    • If the program is already running in a subprocess or detached process, use the CONNECT command to bring the program under debugger control. See Section 9.5.
    • Run a specified image (this is the most common technique):
      1. Choose Run Image... from the File menu on the main window. The Run Image dialog lists the executable images in your current directory (see Figure 9-2).
      2. Click on the name of the image to be debugged. The Image: field displays the image name.
      3. If applicable, enter arguments to be passed to the program in the Arguments: field. If you specify a quoted string, you might have to add quotation marks because the debugger strips quotation marks when parsing the string.
      4. Click on OK.

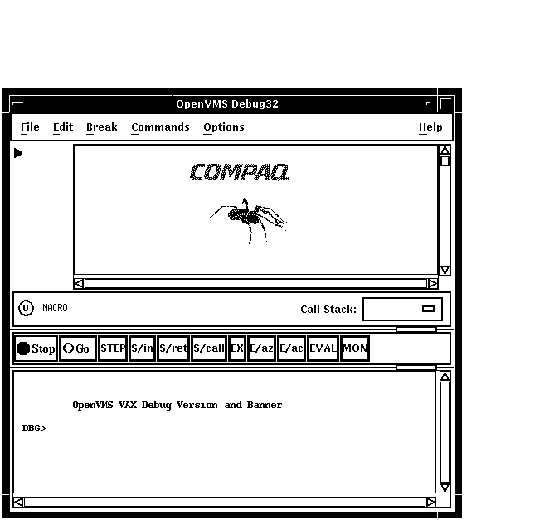
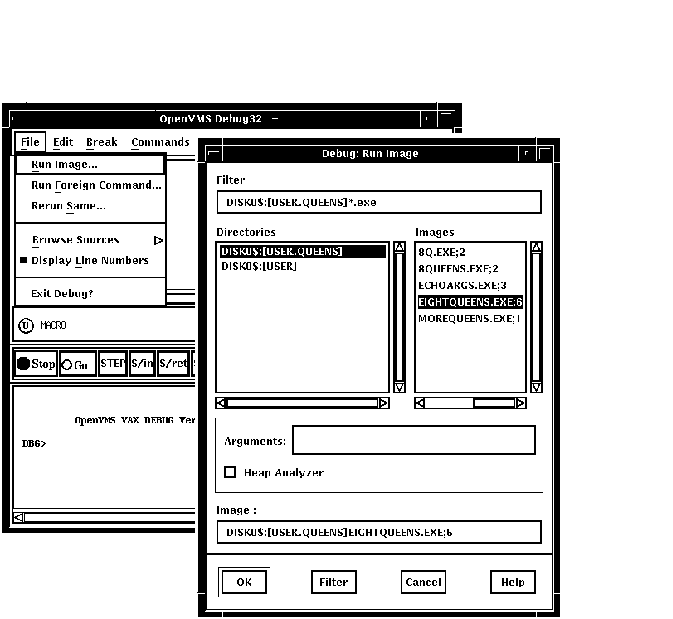
      Figure 9-2 Running a Program by Specifying an Image


    • Run an image by specifying a DCL command or a symbol for a foreign command:
      1. Choose Run Foreign Command... from the File menu on the main window. The Run Foreign Command dialog is displayed (see Figure 9-3).
      2. Enter the symbol in the Foreign Command: field (such a symbol can provide a shortcut around the directory and file selection process). The foreign command X1, shown in Figure 9-3, has been previously defined:


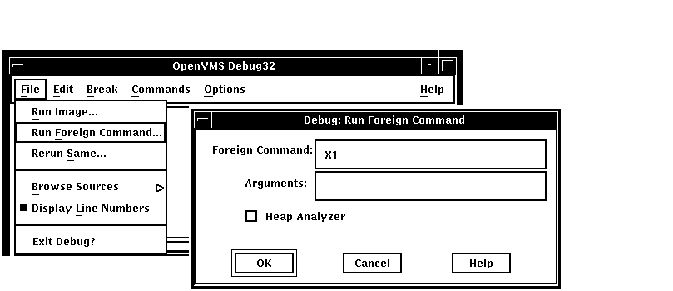
        $X1 :== RUN MYDISK:[MYDIR.MYSUBDIR]EIGHTQUEENS.EXE 
        
      3. Enter any arguments to be passed with the command in the Arguments: field.
      4. Click on OK.

Figure 9-3 Running a Program by Specifying a Command Symbol


Once the debugger has control of the program, the debugger:

  • Displays the program's source code in the main window, as shown in Figure 9-4.
  • Suspends execution at the start of the main program. The current-location pointer to the left of the source code shows which line of code will be executed next.

Figure 9-4 Source Display at Startup


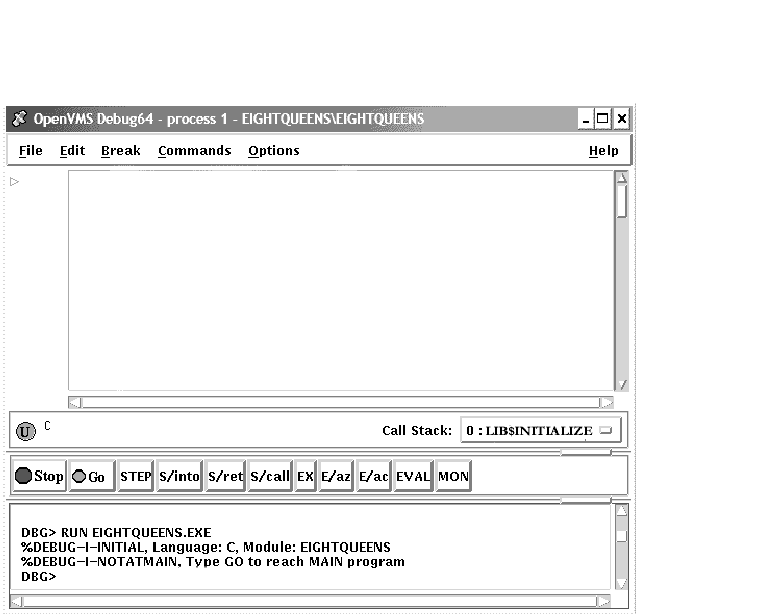
The message displayed in the command view indicates that this debugging session is initialized for a C program and that the name of the source module is EIGHTQUEENS.

With certain programs, the debugger sets a temporary breakpoint to suspend program execution at the start of some initialization code, before the main program, and displays the following message:


Type GO to reach MAIN program
No source line for address: nnnnnnnn

With some of these programs (for example, Ada programs), the breakpoint enables you to debug the initialization code using full symbolic information. The initialization sets up language-dependent debugger parameters. These parameters control the way the debugger parses names and expressions, formats debugger output, and so on.

You can now debug your program as explained in Chapter 10.

Note the following restrictions about running a program under debugger control:

  • You cannot use the procedure in this section to connect the debugger to a running program (see Section 9.8.2).
  • To run a program under debugger control over a network link, you must use the debugger client/server interface. See Section 9.9 for more information.

If you try to run a program that does not exist, or misspell the name of a program that does exist, the following error messages are displayed in the DECterm window, rather than in the command view:


%DCL-W-ACTIMAGE, error activating image 
-CLI-E-IMAGEFNF, image file not found 

9.2 When Your Program Completes Execution

When your program completes execution normally during a debugging session, the debugger issues the following message:


'Normal successful completion' 

You then have the following options:

  • You can rerun your program from the same debugging session (see Section 9.3).
  • You can run another program from the same debugging session (see Section 9.4).
  • You can end the debugging session (see Section 9.7).

9.3 Rerunning the Same Program from the Current Debugging Session

When running the kept debugger (see Section 9.1), you can rerun the program currently under debugger control at any time during a debugging session.

To rerun the program:

  1. Choose Rerun Same... from the File menu on the main window. The Rerun dialog is displayed (see Figure 9-5).
  2. Enter any arguments to be passed to the program, if required, in the Arguments: field. If you specify a quoted string, you might have to add quotation marks because the debugger strips quotation marks when parsing the string.
  3. Choose whether or not to keep the current state of any breakpoints, tracepoints, or static watchpoints that you previously set, activated, or deactivated (see Section 10.4 and Section 10.5.5). Nonstatic watchpoints might or might not be saved, depending on the scope of the variable being watched relative to the main program unit (where execution restarts).
  4. Click on OK.

Figure 9-5 Rerunning the Same Program


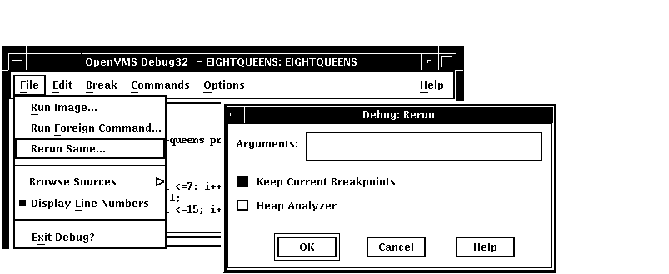
When you rerun a program, it is in the same initial state as a program that is brought under debugger control as explained in Section 9.1, except for any saved breakpoints, tracepoints, or static watchpoints. The source display and current location pointer are updated accordingly.

When you rerun a program, the debugger uses the same version of the image that is currently under debugger control. To debug a different version of that program (or a different program) from the same debugging session, choose Run Image... or Run Foreign Command.. from the File menu on the main window (see Section 9.1).

9.4 Running Another Program from the Current Debugging Session

You can bring another program under debugger control at any time during a debugging session, if you started the debugger as explained in Section 9.1. Follow the procedure in that section for bringing a program under debugger control (also note the restrictions about using that procedure).

9.5 Debugging an Already Running Program

This section describes how to debug a program that is already running in a subprocess or in a detached process. Perform the following steps:

  1. Start the Kept debugger configuration using the DCL command:


    $ DEBUG/KEEP 
    
  2. At the DBG> prompt, use the CONNECT command to interrupt the program and bring it under debug control. CONNECT can be used to attach to a program running in a subprocess or attach to a program running in a detached process. Detached processes must meet both of the following requirements:
    • The detached process UIC must be in the same group as your process
    • The detached process must have a CLI mapped

    The second requirement effectively means that the program must have been started with a command similar to this:


           $ RUN/DETACH/INPUT=xxx.com SYS$SYSTEM:LOGINOUT 
    

    where xxx.com is a command procedure that starts the program with /NODEBUG.
    Once you have connected to the program, the rest of the debugging session is the same as a normal debugger session.
  3. When you have finished debugging the program, do either of the following:
    • Use the DISCONNECT command to release debugger control of the program. The program continues execution.
    • Exit the debugger. The program will terminate.

9.6 Interrupting Program Execution and Aborting Debugger Operations

To interrupt program execution during a debugging session, click on the Stop button on the push button view (see Figure 8-3). This is useful if, for example, the program is in an infinite loop.

To abort a debugger operation in progress, click on Stop. This is useful if, for example, the debugger is displaying a long stream of data.

Clicking on Stop does not end the debugging session. Clicking on Stop has no effect when the program is not running or when the debugger is not executing a command.

9.7 Ending a Debugging Session

To end a debugging session and terminate the debugger, choose Exit Debugger from the File menu on the main window, or enter EXIT at the prompt (to avoid confirmation dialogue). This returns control to system level.

To rerun your program from the current debugging session, see Section 9.3.

To run another program from the current debugging session, see Section 9.4.

9.8 Additional Options for Starting the Debugger

In addition to the startup procedure described in Section 9.1, the following options are available for starting the debugger from DCL level ($):

  • Start the debugger by running the program to be debugged with the DCL command RUN (see Section 9.8.1).
  • Interrupt a running program by pressing Ctrl/Y and then start the debugger using the DCL command DEBUG (see Section 9.8.2).
  • Override the debugger's default (HP DECwindows Motif for OpenVMS user interface (see Section 9.8.3) to achieve the following:
    • Display the HP DECwindows Motif for OpenVMS user interface on another workstation
    • Display the command interface in a DECterm window along with any program input/output (I/O)
    • Display the command interface and program I/O in separate DECterm windows

In all cases, before starting the debugger, verify that you have compiled and linked the modules of your program (as explained in Section 1.2).

9.8.1 Starting the Debugger by Running a Program

You can start the debugger and also bring your program under debugger control in one step by entering the DCL command RUN filespec (assuming the program was compiled and linked with the /DEBUG qualifier).

However, you cannot then use the Rerun or Run features explained in Section 9.3 and Section 9.4, respectively. To rerun the same program or run a new program under debugger control, you must first exit the debugger and start it again.

To start the debugger by running a program, enter the DCL command RUN filespec to start the debugger. For example:


$ RUN EIGHTQUEENS

By default, the debugger starts up as shown in Figure 9-4, executing any user-defined initialization file and displaying the program's source code in the main window. The current-location pointer shows that execution is paused at the start of the main program. The debugger sets the language-dependent parameters to the source language of the main program unit.

For more information about debugger startup, see Section 9.1.

9.8.2 Starting the Debugger After Interrupting a Running Program

You can bring a program that is executing freely under debugger control. This is useful if you suspect that the program might be in an infinite loop or if you see erroneous output.

To bring your program under debugger control:

  1. Enter the DCL command RUN/NODEBUG filespec to execute the program without debugger control.
  2. Press Ctrl/Y to interrupt the executing program. Control passes to the DCL command interpreter.
  3. Enter the DCL command DEBUG to start the debugger.

For example:


$ RUN/NODEBUG EIGHTQUEENS
   .
   .
   .
[Ctrl/Y]
Interrupt
$ DEBUG
[starts debugger]

At startup, the debugger displays the main window and executes any user-defined initialization file, and sets the language-dependent parameters to the source language of the module in which execution was interrupted.

To help you determine where execution was interrupted:

  1. Look at the main window.
  2. Enter the SET MODULES/CALLS command at the command-entry prompt.
  3. Display the Call Stack menu on that window to identify the sequence of routine calls on the call stack. The routine at level 0 is the routine in which execution is currently paused (see Section 10.3.1).

When you start the debugger in this manner, you cannot then use the Rerun or Run features explained in Section 9.3 and Section 9.4, respectively. To rerun the same program or run a new program under debugger control, you must first exit the debugger and start it again.

For more information about debugger startup, see Section 9.1.


Previous Next Contents Index