Software > OpenVMS Systems > Documentation > 84final > 4538 HP OpenVMS Systems Documentation |
OpenVMS Debugger Manual
9.8.3 Overriding the Debugger's Default InterfaceBy default, if your workstation is running HP DECwindows Motif for OpenVMS, the debugger starts up in the HP DECwindows Motif for OpenVMS user interface, which is displayed on the workstation specified by the HP DECwindows Motif for OpenVMS applicationwide logical name DECW$DISPLAY. This section explains how to override the debugger's default DECwindows Motif user interface to achieve the following:
The logical name DBG$DECW$DISPLAY enables you to override the default interface of the debugger. In most cases, there is no need to define DBG$DECW$DISPLAY because the default is appropriate. Section 9.8.3.4 provides more information about the logical names DBG$DECW$DISPLAY and DECW$DISPLAY. 9.8.3.1 Displaying the Debugger's HP DECwindows Motif for OpenVMS User Interface on Another WorkstationIf you are debugging a HP DECwindows Motif for OpenVMS application that uses most of the screen (or if you are debugging pop-ups in a Motif application), you might find it useful to run the program on one workstation and display the debugger's HP DECwindows Motif for OpenVMS user interface on another. To do so:
9.8.3.2 Displaying the Debugger's Command User Interface in a DECterm WindowTo display the debugger's command interface in a DECterm window, along with any program I/O:
For example:
You can now bring your program under debugger control as explained in Section 9.1. 9.8.3.3 Displaying the Command Interface and Program Input/Output in Separate DECterm WindowsThis section describes how to display the debugger's command interface in a DECterm window other than the DECterm window in which you start the debugger. This separate window is useful when using the command interface to debug a screen-oriented program as follows:
The effect is the same as entering the SET MODE SEPARATE command at the DBG> prompt on a workstation running VWS rather than HP DECwindows Motif for OpenVMS. (The SET MODE SEPARATE command is not valid when used in a DECterm window.) The following example shows how to display the debugger's command interface in a separate debugger window titled Debugger.
9.8.3.4 Explanation of DBG$DECW$DISPLAY and DECW$DISPLAYBy default, if your workstation is running HP DECwindows Motif for OpenVMS, the debugger starts up in the HP DECwindows Motif for OpenVMS user interface, which is displayed on the workstation specified by the HP DECwindows Motif for OpenVMS applicationwide logical name DECW$DISPLAY. DECW$DISPLAY is defined in the job table by FileView or DECterm and points to the display device for the workstation. For information about DECW$DISPLAY, see the description of the DCL commands SET DISPLAY and SHOW DISPLAY in the OpenVMS DCL Dictionary. The logical name DBG$DECW$DISPLAY is the debugger-specific equivalent of DECW$DISPLAY. DBG$DECW$DISPLAY is similar to the debugger-specific logical names DBG$INPUT and DBG$OUTPUT. These logical names enable you to reassign SYS$INPUT and SYS$OUTPUT, respectively, to specify the device on which debugger input and output are to appear. The default user interface of the debugger results when DBG$DECW$DISPLAY is undefined or has the same translation as DECW$DISPLAY. By default, DBG$DECW$DISPLAY is undefined. The algorithm that the debugger follows when using the logical definitions of DECW$DISPLAY and DBG$DECW$DISPLAY is as follows:
To enable the OpenVMS Debugger to start up in the HP DECwindows Motif for OpenVMS user interface, first enter one of the following DCL commands:
where WSNAME is the nodename of your workstation. 9.9 Starting the Motif Debug ClientThe OpenVMS Debugger Version 7.2 features a client/server interface that allows you to debug programs running on OpenVMS on a VAX or Alpha CPU from a client interface running on the same or separate system.The debugger client/server retains the functionality of the kept debugger, but splits the debugger into two components: the debug server and the debug client. The debug server runs on an OpenVMS system, and is just like the kept debugger without the user interface. The debug client contains the user interface, and runs on an OpenVMS system using HP DECwindows Motif for OpenVMS, or on a PC running Microsoft Windows 95 or Microsoft Windows NT. 9.9.1 Software RequirementsThe debug server requires OpenVMS Version 7.2 or later. The debug client can run on any of the following:
The OpenVMS Debugger client/server configuration also requires that the following be installed on the OpenVMS node running the server:
9.9.2 Starting the ServerYou can start the debug server after logging in directly to the OpenVMS system, or you may find it more convenient to log in remotely with a product such as eXcursion, or an emulator such as Telnet. To start the debug server, enter the following command:
The server displays its network binding strings. The server port number is enclosed in square brackets ([]). For example:
Use one of the network binding strings to identify this server when you connect from the client (see Section 9.9.4). The following table matches the network binding string prefix with its associated network transport:
The following example contains an error message that indicates that DCE is not installed:
This indicates that DCE is installed but not configured. 9.9.3 Primary Clients and Secondary ClientsThe debugger client/server interface allows more than one client to be connected to the same server. This allows team debugging, classroom sessions, and other applications. The primary client is the first client to connect to the server. A secondary client is an additional client that has connected to the same server. The primary client controls whether or not any secondary clients can connect to the server. Section 9.9.4 describes how to specify the number of secondary clients allowed in a session. 9.9.4 Starting the Motif ClientA session is the connection between a particular client and a particular server. Each session is identified within the client by the network binding string the client used to connect to the server. Once the debug server is running, start the Motif debug client. To do so, enter the following command:
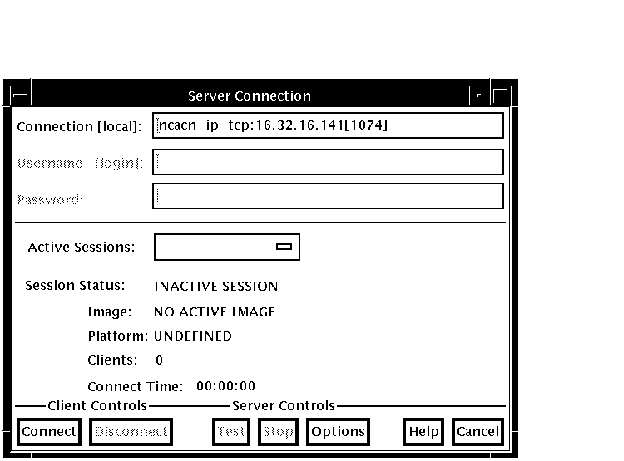
To establish a session from the Motif debug client, click on Server Connection from the File menu. The Server Connection dialog displays, in the Connection list, the default network binding string. This string is based on the last string you entered, or the node on which the client is running. There is not necessarily a server associated with the default binding string. Figure 9-6 shows the Server Connection dialog. Figure 9-6 Debug Server Connection Dialog 
From the buttons at the bottom of the Server Connection dialog, you can
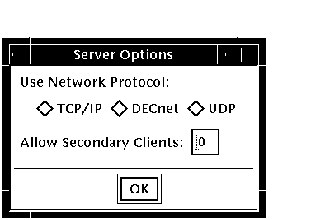
In addition, the Options button invokes the Server Options dialog, which allows you to select the network transport to be used (see Section 11.5.1). The Server Options dialog also allows you to select the number of secondary clients (0-31) allowed for a new session. Figure 9-7 shows the Server Options dialog. Figure 9-7 Server Options Dialog 
To connect the client to a server, perform the following steps:
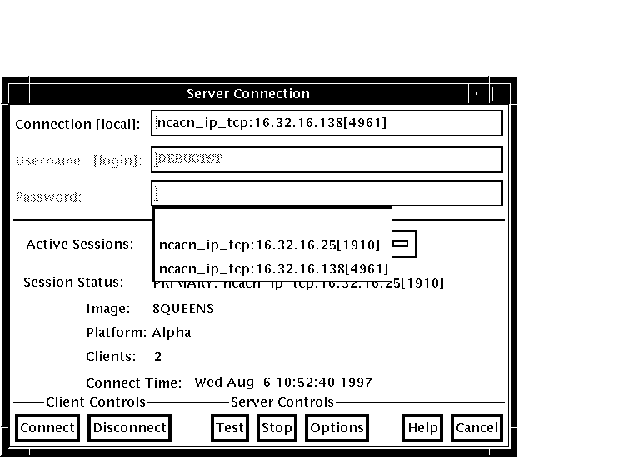
You can establish connections to an unlimited number of servers by repeating the sequence above and specifying the new network binding string each time. 9.9.5 Switching Between SessionsEach time you connect to a server and initiate a session, the session is listed in the Active Sessions list in the Server Connection dialog (see Figure 9-8). You can switch back and forth between sessions. Each time you switch to a new session, the debugger updates the contents of any open debugger displays with the new context. To switch to a different session, perform the following steps:
Note that you cannot change the number of secondary clients allowed on a session while that session is active. To change the number of clients allowed on a session, you must be the primary client, and perform the following steps:
Figure 9-8 Active Sessions List 
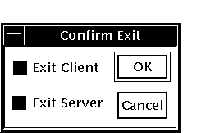
9.9.6 Closing a Client/Server SessionClick on Exit Debug? on the File menu to invoke the Confirm Exit dialog. Figure 9-9 shows the Confirm Exit dialog. Figure 9-9 Confirm Exit Dialog 
Once you have invoked the Confirm Exit dialog, perform one of the following:
If you do not terminate the debug server, you can connect to the server from another debug client. If you do not terminate the client, you can connect to another server for which you know the network binding string.
|