 |
HP OpenVMS System Analysis Tools Manual
SHOW POOL
Displays the contents of the nonpaged dynamic storage pool, the
bus-addressable pool, and the paged dynamic storage pool. You can
display part or all of each pool. If you do not specify a range or
qualifiers, the default is SHOW POOL/ALL. Optionally, you can display
the pool history ring buffer and pool statistics.
Format
SHOW POOL [range | /ALL (d)| /BAP | /NONPAGED | /PAGED]
[ /BRIEF |
/CHECK | /FREE | /HEADER | /MAXIMUM_BYTES [=n] | /SUMMARY |
/TYPE=packet-type | /SUBTYPE=packet-type | /UNUSED ]
[/RING_BUFFER[=address]]
[/STATISTICS [=ALL]
[/NONPAGED | /BAP | /PAGED]
Parameter
range
Range of virtual addresses in pool that SDA is to examine. You can
express a range using the following syntax:
|
m:n
|
Range of virtual addresses in pool from
m to
n
|
|
m;n
|
Range of virtual addresses in pool starting at
m and continuing for
n bytes
|
Qualifiers
/ALL
Displays the entire contents of the dynamic storage pool, except for
those portions that are free (available). This is the default behavior
of the SHOW POOL command.
/BAP
Displays the contents of the bus-addressable dynamic storage pool
currently in use.
/BRIEF
Displays only general information about the dynamic storage pool and
its addresses.
/CHECK
Checks all free packets for POOLCHECK-style corruption, in exactly the
same way that the system does when generating a POOLCHECK crash dump.
/FREE
Displays the entire contents, both allocated and free, of the specified
region or regions of pool. Use the /FREE qualifier with a
range to show all of the used and free pool in the
given range.
/HEADER
Displays only the first 16 bytes of each data packet found within the
specified region or regions of pool.
/MAXIMUM_BYTES [=n]
Displays only the first n bytes of a pool packet; if you
specify /MAXIMUM_BYTES without a value, the default is 64 bytes.
/NONPAGED
Displays the contents of the nonpaged dynamic storage pool currently in
use.
/PAGED
Displays the contents of the paged dynamic storage pool currently in
use.
/RING_BUFFER [=address]
Displays the contents of the pool history ring buffer if pool checking
has been enabled. Entries are displayed in reverse chronological order,
that is, most to least recent. If address is specified, the
only entries in the ring buffer displayed are for pool blocks that
address lies within.
/STATISTICS [= ALL]
Displays usage statistics about each lookaside list and the variable
free list. For each lookaside list, its queue header address, packet
size, the number of packets, attempts, fails, and deallocations are
displayed. (If pool checking is disabled, the attempts, fails, and
deallocations are not displayed.) For the variable free list, its queue
header address, the number of packets and the size of the smallest and
largest packets are displayed. You can further qualify /STATISTICS by
using either /NONPAGED, /BAP, or /PAGED to display statistics for a
specified pool area. Paged pool only has lookaside lists if the system
parameter PAGED_LAL_SIZE has been set to a nonzero value; therefore
paged pool lookaside list statistics are only displayed if there has
been activity on a list.
If you specify /STATISTICS without the ALL keyword, only active
lookaside lists are displayed. Use /STATISTICS = ALL to display all
lookaside lists.
/SUBTYPE=packet-type
Displays the packets within the specified region or regions of pool
that are of the indicated packet-type. For information on
packet-type, see packet-type in the Description
section.
/SUMMARY
Displays only an allocation summary for each specified region of pool.
/TYPE=packet-type
Displays the packets within the specified region or regions of pool
that are of the indicated packet-type. For information on
packet-type, see packet-type in the Description
section.
/UNUSED
Displays only variable free packets and lookaside list packets, not
used packets.
Description
The SHOW POOL command displays information about the contents of any
specified region of dynamic storage pool. There are several distinct
display formats, as follows:
- Pool layout display. This display includes the addresses of the
pool structures and lookaside lists, and the ranges of memory used for
pool.
- Full pool packet display. This display has a section for each
packet, consisting of a summary line (the packet type, its start
address and size, and, on systems that have multiple Resource Affinity
Domains (RADs), the RAD number), followed by a dump of the contents of
the packet in hexadecimal and ASCII.
- Header pool packet display. This display has a single line for each
packet. This line contains the packet type, its start address and size,
and, on systems that have multiple RADs, the RAD number, followed by
the first 16 bytes of the packet, in hexadecimal and ASCII.
- Pool summary display. This display consists of a single line for
each packet type, and includes the type, the number of occurrences and
the total size, and the percentage of used pool consumed by this packet
type.
- Pool statistics display. This display consists of statistics for
variable free pool and for each lookaside list. For variable free pool,
it includes the number of packets, the total bytes available, and the
sizes of the smallest and largest packets. In addition, if pool
checking is enabled, the total bytes allocated from the variable list
and the number of times pool has been expanded are also displayed.
For lookaside lists, the display includes the listhead address and
size, the number of packets (both the maintained count and the actual
count), the operation sequence number for the list, the allocation
attempts and failures, and the number of deallocations.
On systems
with multiple RADs, statistics for on-RAD deallocations are included in
the display for the first RAD.
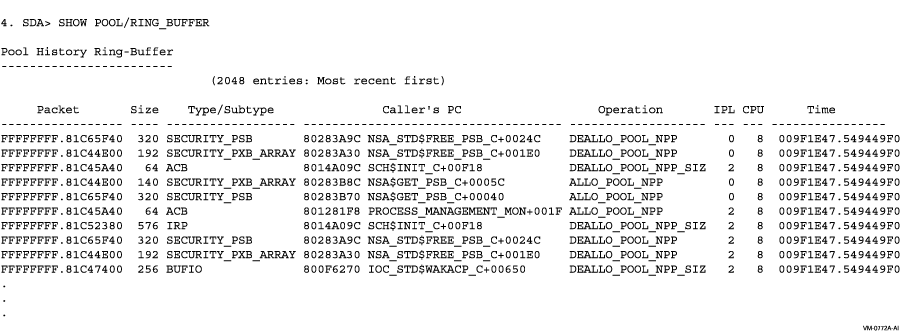
- Ring buffer display. This display is only available when pool
checking is enabled. It consists of one line for each packet in the
ring buffer and includes the address and size of the pool packet being
allocated or deallocated, its type, the PC of the caller and the pool
routine called, the CPU and IPL of the call, and the system time.
Optionally, the ring buffer display can be limited to only the
entries that contain a given address.
The qualifiers used on the SHOW POOL command determine which displays
are generated. The default is the pool layout display, followed by the
full pool packet display, followed by the pool summary display, these
being generated in turn for Nonpaged Pool, Bus-Addressable Pool (if it
exists in the system or dump being analyzed), and then Paged Pool.
If you specify a range, type, or subtype, then the pool layout display
is not generated, and the pool summary display is a summary only for
the range, type, or subtype, and not for the entire pool.
Not all displays are relevant for all pool types. For example, Paged
Pool may have no lookaside lists, in which case the Paged Pool
statistics display will consist only of variable free pool information.
And because there is a single ring buffer for all pools, only one ring
buffer display is generated even if all pools are being displayed.
Packet-type
Each packet of pool has a type field (a byte containing a value in the
range of 0-255). Many of these type values have names associated that
are defined in $DYNDEF in SYS$LIBRARY:LIB.MLB. The packet-type
specified in the /TYPE qualifier of the SHOW POOL command can either be
the value of the pool type or its associated name.
Some pool packet types have an additional subtype field (also a byte
containing a value in the range of 0--255), many of which also have
associated names. The packet-type specified in the /SUBTYPE
qualifier of the SHOW POOL command can either be the value of the pool
type or its associated name. However, if given as a value, a /TYPE
qualifier (giving a value or name) must also be specified. Note also
that /TYPE and /SUBTYPE are interchangeable if packet-type is
given by name. Table 4-19 shows several examples.
Table 4-19 /TYPE and /SUBTYPE Qualifier Examples
| /TYPE and /SUBTYPE Qualifiers |
Meaning |
|
/TYPE = CI
|
All CI packets regardless of subtype
|
|
/TYPE = CI_MSG
|
All CI packets with subtype CI_MSG
|
|
/TYPE = MISC/SUBTYPE = 120
|
All MISC packets with subtype 120
|
|
/TYPE = 0 or /TYPE = UNKNOWN
|
All packets with an unknown TYPE/SUBTYPE combination
|
Examples


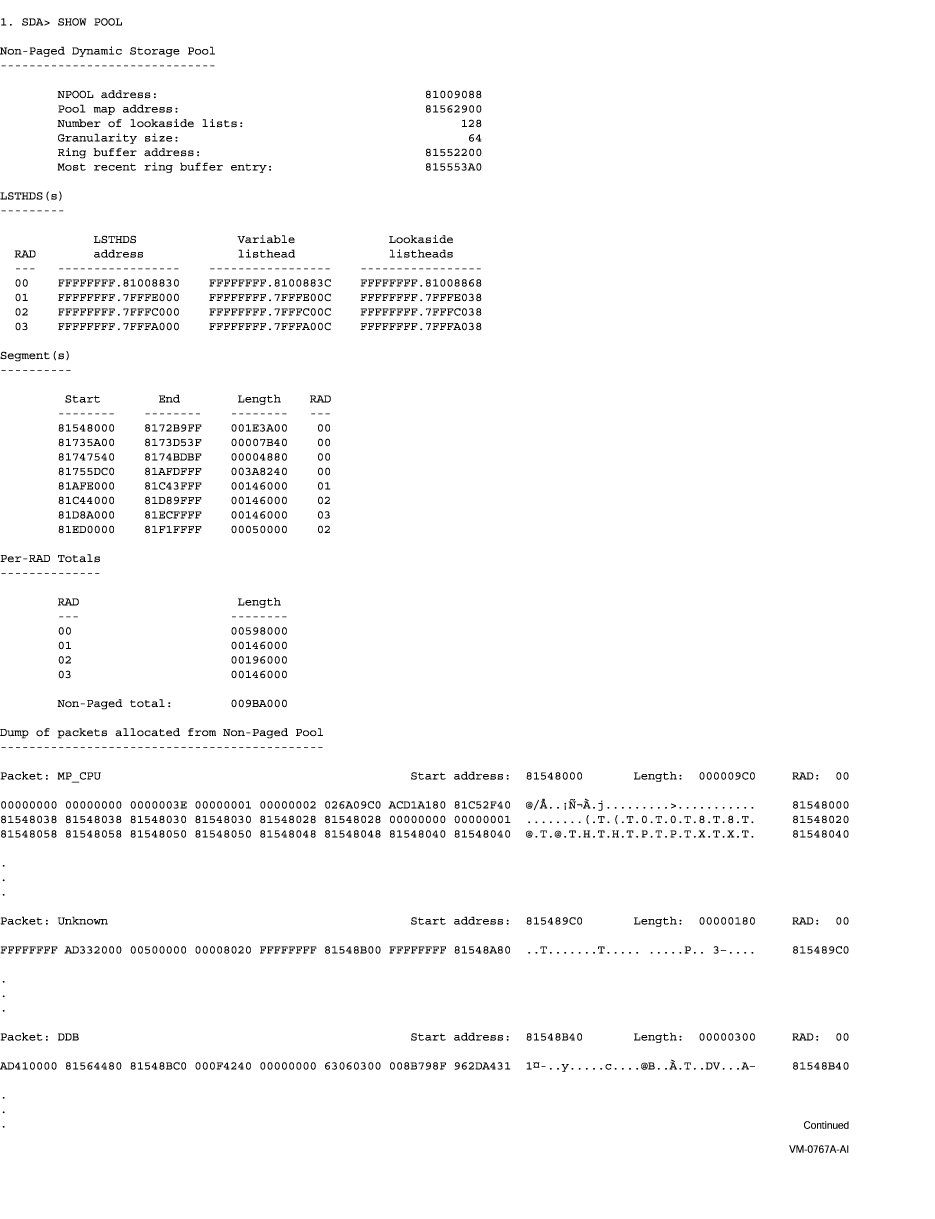
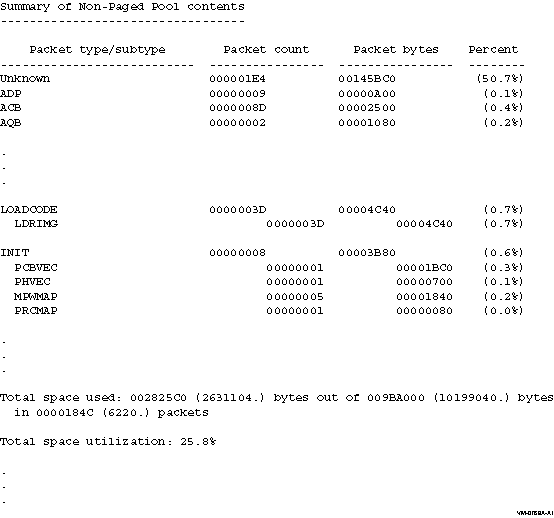
This example shows the Nonpaged Pool portion of the default SHOW POOL
display.
2. SDA> SHOW POOL/TYPE=IPC/HEADER 8156E140:815912C0

Non-Paged Dynamic Storage Pool
------------------------------

Dump of packets allocated from Non-Paged Pool
---------------------------------------------

   Packet type/subtype     Start    Length   RAD                    Header contents
-------------------------  -------- -------- ---   -----------------------------------------------------
IPC_TDB                    8156E140 00000040  00   81591180 057B0040 00000040 81591180  ..Y.@...@.{...Y.
IPC_LIST                   815838C0 00009840  00   004C0200 087B9840 0057A740 8158D100  .ÑX.@§W.@.{...L.
IPC_LIST                   8158D100 00001840  00   00040400 087B1840 00570F00 8158E940  @éX...W.@.{.....
IPC_LIST                   8158E940 00002840  00   00140200 087B2840 0056F6C0 81591180  ..Y.ÀöV.@({.....
IPC_TPCB                   81591180 00000080  00   00000000 067B0080 0056CE80 81591200  ..Y..ÎV...{.....
IPC                        81591200 000000C0  00   00000000 007B00C0 0056CE00 815912C0  À.Y..ÎV.À.{.....

Summary of Non-Paged Pool contents
----------------------------------

    Packet type/subtype        Packet count      Packet bytes    Percent
---------------------------  ----------------  ----------------  --------
IPC                          00000006          0000DA40          (100.0%)
  IPC                                00000001          000000C0    (0.3%)
  IPC_TDB                            00000001          00000040    (0.1%)
  IPC_TPCB                           00000001          00000080    (0.2%)
  IPC_LIST                           00000003          0000D8C0   (99.3%)

Total space used: 0000DA40 (55872.) bytes out of 00023180 (143744.) bytes
  in 00000006 (6.) packets

Total space utilization: 38.9%
|
This example shows how you can specify a pool packet type and a range
of addresses.
3. SDA> SHOW POOL/STATISTICS

Non-Paged Pool statistics for RAD 00
------------------------------------

        On-RAD deallocations (all RADs):                    1221036
        Total deallocations (all RADs):                     1347991
        Percentage of on-RAD deallocations:                   90.6%

Variable list statistics
------------------------

        Number of packets on variable list:                       7
        Total bytes on variable list:                       3613376
        Smallest packet on variable list:                       256
        Largest packet on variable list:                    3598016
        Bytes allocated from variable list:                 2140480
        Times pool expanded:                                      0

Lookaside list statistics
-------------------------

                      List   Packets     Packets    Operation   Allocation  Allocation
  Listhead address    size   (approx)    (actual)   sequence #   attempts    failures    Deallocs
  -----------------   ----  ----------  ----------  ----------  ----------  ----------  ----------
  FFFFFFFF.81008870     64           5           5       10057       10549         492       10062
  FFFFFFFF.81008878    128          21          21         366        4881        4515         387
  FFFFFFFF.81008880    192          33          33       27376       27542         166       27409
  FFFFFFFF.81008888    256           4           4        8367        8476         118        8362

   .
   .
   .
|
This example shows the Nonpaged Pool portion of the SHOW
POOL/STATISTICS display.

This example shows the output of the SHOW POOL/RING_BUFFER display.
4. SDA> SHOW POOL/PAGED/STATISTICS

Paged Pool statistics
---------------------

Variable list statistics
------------------------
        Number of packets on variable list:                     30
        Total bytes on variable list:                      4778288
        Smallest packet on variable list:                       16
        Largest packet on variable list:                   4777440

Lookaside list statistics
-------------------------
                        List                  Operation
  Listhead address      size     Packets      sequence #
  -----------------     ----    ----------    ----------
         ...
  FFFFFFFF.882119D0       80             0             1
         ...
|
This example shows the output of paged pool statistics when the system
parameter PAGED_LAL_SIZE has been set to a nonzero value.
SHOW PORTS
Displays those portions of the port descriptor table (PDT) that are
port independent.
Format
SHOW PORTS [/qualifier[,...]]
Parameters
None.
Qualifiers
/ADDRESS=pdt-address
Displays the specified port descriptor table (PDT). You can find the
pdt-address for any active connection on the system in the
PDT summary page display of the SHOW PORTS command.
This command also defines the symbol PE_PDT. The connection descriptor
table (CDT) addresses are also stored in many individual data
structures related to System Communications Services (SCS) connections,
for instance, in the path block displays of the SHOW CLUSTER/SCS
command.
/BUS=bus-address
Displays bus (LAN device) structure data.
/CHANNEL=channel-address
Displays channel (CH) data.
/DEVICE
Displays the network path description for a channel.
/MESSAGE
Displays the message data associated with a virtual circuit (VC).
/NODE=node
Shows only the virtual circuit block associated with the specific node.
When you use the /NODE qualifier, you must also specify the address of
the PDT using the /ADDRESS qualifier.
/VC=vc-address
Displays the virtual circuit data.
Description
The SHOW PORTS command provides port-independent information from the
port descriptor table (PDT) for those CI ports with full System
Communications Services (SCS) connections. This information is used by
all SCS port drivers.
The SHOW PORTS command also defines symbols for PEDRIVER based on the
cluster configuration. These symbols include the following information:
- Virtual circuit (VC) control blocks for each of the remote systems
- Bus data structure for each of the local LAN adapters
- Some of the data structures used by both PEDRIVER and the LAN
drivers
The following symbols are defined automatically:
- VC_nodename---Example: VC_NODE1, address of the local node's
virtual circuit to node NODE1.
- CH_nodename---The preferred channel for the virtual circuit. For
example, CH_NODE1, address of the local node's preferred channel to
node NODE1.
- BUS_busname---Example: BUS_ETA, address of the local node's bus
structure associated with LAN adapter ETA0.
- PE_PDT---Address of PEDRIVER's port descriptor table.
- MGMT_VCRP_busname---Example: MGMT_VCRP_ETA, address of the
management VCRP for bus ETA.
- HELLO_VCRP_busname---Example: HELLO_VCRP_ETA, address of the HELLO
message VCRP for bus ETA.
- VCIB_busname---Example: VCIB_ETA, address of the VCIB for bus ETA.
- UCB_LAVC_busname---Example: UCB_LAVC_ETA, address of the LAN
device's UCB used for the local-area OpenVMS Cluster protocol.
- UCB0_LAVC_busname---Example: UCB0_LAVC_ETA, address of the LAN
device's template UCB.
- LDC_LAVC_busname---Example: LDC_LAVC_ETA, address of the LDC
structure associated with LAN device ETA.
- LSB_LAVC_busname---Example: LSB_LAVC_ETA, address of the LSB
structure associated with LAN device ETA.
These symbols equate to system addresses for the corresponding data
structures. You can use these symbols, or an address, in SHOW PORTS
qualifiers that require an address, as in the following:
SDA >SHOW PORTS/BUS=BUS_ETA
|
The SHOW PORTS command produces several displays. The initial display,
the PDT summary page, lists the PDT address, port
type, device name, and driver name for each PDT. Subsequent displays
provide information taken from each PDT listed on the summary page.
You can use the /ADDRESS qualifier to the SHOW PORTS command to produce
more detailed information about a specific port. The first display of
the SHOW PORTS/ADDRESS command duplicates the last display of the SHOW
PORTS command, listing information stored in the port's PDT. Subsequent
displays list information about the port blocks and virtual circuits
associated with the port.
Examples
| #1 |
SDA > SHOW PORTS
OpenVMS Cluster data structures
--------------------------

                  --- PDT Summary Page ---

 PDT Address          Type         Device          Driver Name
 -----------          ----         -------         -----------

  80E2A180             pn          PNA0            SYS$PNDRIVER
  80EC3C70             pe          PEA0            SYS$PEDRIVER

                  --- Port Descriptor Table (PDT) 80E2A180 ---

Type: 09 pn
Characteristics: 0000

Msg Header Size          104  Flags               0000  Message Sends    3648575
Max Xfer Bcnt       00100000  Counter CDRP    00000000  Message Recvs    4026887
Poller Sweep              21  Load Vector     80E2DFCC  Mess Sends NoFP  3020422
Fork Block W.Q.     80E2A270  Load Class            60  Mess Recvs NoFP  3398732
UCB Address         80E23380  Connection W.Q. 80E4BF94  Datagram Sends         0
ADP Address         80E1BF00  Yellow Q.       80E2A2E0  Datagram Recvs         0
Max VC timeout            16  Red Q.          80E2A2E8  Portlock        80E1ED80
SCS Version                2  Disabled Q.     80FABB74  Res Bundle Size      208
                              Port Map        00000001

                  --- Port Descriptor Table (PDT) 80EC3C70 ---

Type: 03 pe
Characteristics: 0000

Msg Header Size           32  Flags               0000  Message Sends     863497
Max Xfer Bcnt       FFFFFFFF  Counter CDRP    00000000  Message Recvs     886284
Poller Sweep              30  Load Vector     80EDBF8C  Mess Sends NoFP   863497
Fork Block W.Q.     80EC3D60  Load Class            10  Mess Recvs NoFP   886284
UCB Address         80EC33C0  Connection W.Q. 80EFF5D4  Datagram Sends         0
ADP Address         00000000  Yellow Q.       80EC3DD0  Datagram Recvs         0
Max VC timeout            16  Red Q.          80EC3DD8  Portlock        00000000
SCS Version                2  Disabled Q.     812E72B4  Res Bundle Size        0
                              Port Map        00000000
|
This example illustrates the default output of the SHOW PORTS command.
| #2 |
SDA > SHOW PORTS/ADDRESS=80EC3C70
OpenVMS Cluster data structures
--------------------------

                  --- Port Descriptor Table (PDT) 80EC3C70 ---

Type: 03 pe
Characteristics: 0000

Msg Header Size           32  Flags               0000  Message Sends     864796
Max Xfer Bcnt       FFFFFFFF  Counter CDRP    00000000  Message Recvs     887086
Poller Sweep              30  Load Vector     80EDBF8C  Mess Sends NoFP   864796
Fork Block W.Q.     80EC3D60  Load Class            10  Mess Recvs NoFP   887086
UCB Address         80EC33C0  Connection W.Q. 80EFF5D4  Datagram Sends         0
ADP Address         00000000  Yellow Q.       80EC3DD0  Datagram Recvs         0
Max VC timeout            16  Red Q.          80EC3DD8  Portlock        00000000
SCS Version                2  Disabled Q.     812E72B4  Res Bundle Size        0
                              Port Map        00000000
                              Port Map        00000000

                 --- Port Block 80EC4540 ---

Status: 0001 authorize
VC Count: 20
Secs Since Last Zeroed: 77020

SBUF Size             824     LBUF Size         5042     Fork Count     1943885
SBUF Count             28     LBUF Count           1     Refork Count         0
SBUF Max              768     LBUF Max           384     Last Refork   00000000
SBUF Quo               28     LBUF Quo             1     SCS Messages   1154378
SBUF Miss            1871     LBUF Miss         3408     VC Queue Cnt    361349
SBUF Allocs       1676801     LBUF Allocs      28596     TQE Received    770201
SBUFs In Use            2     LBUFs In Use         0     Timer Done      770201
Peak SBUF In Use      101     Peak LBUF In Use    10     RWAITQ Count     30288
SBUF Queue Empty        0     LBUF Queue Empty     0     LDL Buf/Msg      32868
TR SBUF Queue Empty     0     Ticks/Second        10     ACK Delay      1000000
No SBUF for ACK         0     Listen Timeout       8     Hello Interval      30

Bus Addr  Bus     LAN Address    Error Count Last Error   Time of Last Error
--------  ---  ----------------- ----------- ---------- -----------------------
80EC4C00  LCL  00-00-00-00-00-00           0
80EC5400  EXA  08-00-2B-17-CF-92           0
80EC5F40  FXA  08-00-2B-29-E1-40           0

                 --- Virtual Circuit (VC) Summary ---

VC Addr     Node    SCS ID  Lcl ID    Status Summary        Last Event Time
--------  --------  ------  ------  -----------------   -----------------------
80E566C0  ARUSHA     19617  223/DF  open,path            8-FEB-2001 16:01:57.58
80E98840  ETOSHA     19699  222/DE  open,path            8-FEB-2001 16:01:58.41
80E98A80  VMS        19578  221/DD  open,path            8-FEB-2001 16:01:58.11
   .
   .
   .
|
This example illustrates the output produced by the SHOW PORTS command
for the PDT at address 80EC3C70.
|
