Figure 5-4 OpenVMS Data Collection Customization
On the Data Collection Customization page, for example, the Event interval for Disk Status data collection is every 15 seconds.
| Previous | Contents | Index |
The Availability Manager Data Analyzer displays a great deal of OpenVMS Cluster data. The amount of cluster information has increased in each successive version of the product and will probably continue to do so. To accommodate future growth in this area, beginning with Availability Manager Version 2.2, OpenVMS Cluster information is documented in a separate chapter of this manual.
By clicking a series of "handles" on the cluster node tree in the Cluster Members pane of the Cluster Summary page (Figure 4-1), you can open lines of data to display progressively more detailed cluster data. This chapter describes the data you can display.
Support for Managed Objects
New support has been added to the OpenVMS Data Collector, RMDRIVER, for OpenVMS managed objects, which are operating system components with characteristics that allow the Availability Manager to manage them. Managed objects, which register themselves with the Data Collector at system startup, not only provide data but also implement fixes in response to client requests.
In OpenVMS Version 7.3 and later versions, cluster data and fixes are available for LAN virtual circuits through the managed object interface. When the Data Analyzer connects to a Data Collector node, it retrieves a list of the managed objects on that node, if any. For such a node, the Data Analyzer can provide additional details and any new data that would otherwise be unavailable.
To enable managed object data collection on nodes running OpenVMS Version 7.3 and later, the system manager must take steps so that the Data Collector driver, RMDRIVER, is loaded early in the boot process. For more details on how to enable collection of managed object data, see the HP Availability Manager Installation Instructions. |
LAN Displays
When you monitor OpenVMS Version 7.3 and later nodes with managed
objects enabled, additional cluster data and fixes are available for
LAN virtual circuits. This data includes enhanced LAN virtual circuit
summary data in the Cluster Summary window and the LAN Virtual Circuit
Details (NISCA) window. In addition, the Cluster Summary includes
virtual circuit, channel, and device fixes. If managed object support
is not enabled for a Data Collector node, then only basic virtual
circuit data is available.
4.1 OpenVMS Cluster Summary Page
To display the OpenVMS Cluster Summary page (Figure 4-1), click the Cluster Summary tab on an OpenVMS Node Summary page (Figure 1-7).
The Cluster Summary page contains cluster interconnect information for an entire cluster as well as detailed information about each node in the cluster, including System Communications Services (SCS) circuits and connections for individual nodes.
The data items shown on this page correspond to data that the Show Cluster utility (SHOW CLUSTER) displays for the SYSTEMS, MEMBERS, CONNECTIONS, and CIRCUITS classes. No SHOW CLUSTER counterpart exists for the PEDRIVER LAN virtual circuit, channel, and device detail displays. The data items shown on the page also correspond to data that the SCACP utility displays for SHOW commands that display PORT, CIRCUIT, VC, CHANNEL, and LAN DEVICE information.
Figure 4-1 OpenVMS Cluster Summary
The two panes in the Cluster Summary page display the following information:
The Data Analyzer signals the LOVOTE event when cluster votes minus cluster quorum is less than the threshold value for the event. (The default threshold for the LOVOTE event is 1.)
LOVOTE, 'node' VOTES count is close to or below QUORUM
|
Table 4-1 describes the data in the OpenVMS Cluster Summary pane (Figure 4-1).
| Data | Description |
|---|---|
| Formed | Date and time the cluster was formed. |
| Last Trans | Date and time of the most recent cluster state transition. |
| Votes | Total number of quorum votes being contributed by all cluster members and by the quorum disk. |
| Expected Votes | The expected votes contribution by all members of the cluster. This value is calculated from the maximum EXPECTED_VOTES system parameter and the maximized value of the VOTES system parameter. |
| Failover Step | Current failover step index. Shows which step in the sequence of failover steps the failover is currently executing. |
| Members In | Number of cluster members to which the Data Analyzer has a connection. |
| Members Out | Number of cluster members to which the Data Analyzer either has no connection or has lost its connection. |
| Quorum 1 | Number of votes that must be present for the cluster to function and to permit user activity, that is, to "maintain cluster quorum." |
| QD Votes | Number of votes given to the quorum disk. A value of 65535 means no quorum disk exists. |
| Failover ID | Failover instance identification. Unique ID of a failover sequence that indicates to system managers whether a failover has occurred since the last time they checked. |
The Cluster Members pane (the lower pane on the Cluster Summary page (Figure 4-1) lists all the nodes in the cluster and provides detailed information about each one. Figure 4-2 shows only the Cluster Members pane.
Figure 4-2 OpenVMS Cluster Members Pane
The first level of information in the Cluster Members pane is cluster member data, which is described in Table 4-2.
| Data | Description | ||||||||||||||||||
|---|---|---|---|---|---|---|---|---|---|---|---|---|---|---|---|---|---|---|---|
| SCS Name | System Communications Services (SCS) name for the node (system parameter SCSNODE). | ||||||||||||||||||
| SCSID | SCS identification for the node (system parameter SCSYSTEMID). | ||||||||||||||||||
| CSID | Cluster system identification. | ||||||||||||||||||
| Votes | Number of votes the member contributes. | ||||||||||||||||||
| Expect | Member's expected votes as set by the EXPECTED_VOTES system parameter. | ||||||||||||||||||
| Quorum | Number of votes that must be present for the cluster to function and permit user activity, that is, to "maintain cluster quorum." | ||||||||||||||||||
| LckDirWt | Lock manager distributed directory weight as determined by the LCKDIRWT system parameter. | ||||||||||||||||||
| Status |
Current cluster member status:
|
||||||||||||||||||
| Transition Time | The time of the system's last change in cluster membership status. |
The following sections contain descriptions of the categories of summary data displayed in the Cluster Members pane (Figure 4-2).
When you click the handle before an SCS (System Communications Services) Name, the Data Analyzer first displays a Ports heading, if managed object data collection is enabled on this SCS node.
A port is an OpenVMS device that provide SCA (System
Communications Architecture) services. Port summary data is discussed
in Section 4.2.1. Below the Ports heading is the Circuits heading,
which precedes a line of SCA headings. (SCA data is discussed in
Section 4.2.2.)
4.2.1 Port Summary Data
When you initially click the handle in front of Ports in the Cluster Members pane (Figure 4-1) to a vertical position, Ports headings are displayed, with information about port interfaces on the local system, as shown in Figure 4-3.
Figure 4-3 Port Summary Data
The port summary data shown in Figure 4-3 is described in Table 4-3. Data items in this table are related to the SCACP utility SHOW PORTS display and the SHOW CLUSTER utility LOCAL_PORT CLASS display.
| Data | Description | |
|---|---|---|
| Local Port: | ||
| Name | Device name of the port. | |
| Number | The local port's interconnect address or other interconnect-specific identifier. | |
| Mgmt Priority | Management priority assigned to the port. | |
| Load Class | Capacity value of the port, based on the rate (in megabits/second) of the interconnect of the port. | |
| Messages Sent: | ||
| Count | Total number of messages sent since the port was initialized. | |
| Rate | Rate at which messages are sent (per second). | |
| Messages Received: | ||
| Count | Total number of messages sent since the port was initialized. | |
| Rate | Rate at which SCS messages are received (per second). | |
| Datagrams Sent: | ||
| Count | Total number of SCS datagrams sent since the port was initialized. | |
| Rate | Rate at which SCS datagrams are sent (per second). | |
| Datagrams Received: | ||
| Count | Total number of SCS datagrams sent since the port was initialized. | |
| Rate | Rate at which SCS datagrams are sent (per second). | |
| Kilobytes Mapped | Number of kilobytes mapped for block transfer. | |
Below the Circuits heading in Figure 4-4 is a line of SCA summary headings that include information about a node's SCS circuits between local SCA ports and remote SCA ports on other nodes in the cluster. More than one circuit indicates more than one communications path to the other node.
The data displayed in Figure 4-4 is similar to the information that the Show Cluster utility (SHOW CLUSTER) displays for the CIRCUITS, CONNECTIONS, and COUNTERS classes and that the SCACP utility's SHOW CIRCUITS command displays. Note that circuit count is the total number of events since the the state of the circuit changed to OPEN.
Starting with Availability Manager Version 2.2, the circuits display shows circuits to non-OpenVMS nodes, such as storage controllers.
Figure 4-4 SCA Summary Data
Table 4-4 describes the SCA summary data displayed under the Circuits heading in Figure 4-4. Each line of data shows either a summary of an SCS connection between a local system connection of an application (or SYSAP) to a remote SYSAP that uses the circuit, or a summary of interconnect-specific information about the operation of the circuit.
Some of the data described in Table 4-4 is not displayed in Figure 4-4 because the screen display is wider than shown. You can scroll to the right on your terminal screen to display the remaining fields described in the table.
Each rate referred to in Figure 4-4 is in messages per second. The "Message Rates" data are rates; the remaining data items are counts. |
| Data | Description | |
|---|---|---|
| Remote Node | SCS name of the remote node containing the remote port of the circuit. | |
| Local Port | The device name of the local port associated with the circuit. | |
| Remote Port: | ||
| Type | The remote port's device or interconnect type associated with the circuit (for example, LAN, CIPCA, DSSI). | |
| Number | The remote port's interconnect address, or another other interconnect-specific unique identifier. | |
| State | The state of the virtual circuit connection. | |
| Priority: | ||
| Curr | Circuit's current priority, which is the sum of the management priorities assigned to the circuit and associated local port. | |
| Mgmt | Priority value assigned to the circuit by management action. | |
| Load Class | The circuit's current capacity rating, derived from the current ECS member's load class values. | |
| Message Rates: | ||
| Sent | Count/rate of SCS messages sent over the circuit. | |
| Received | Count/rate that SCS messages are received on the circuit. | |
| Block Data (Kilobytes): | ||
| Mapped | Count/rate of kilobytes mapped for block data transfers over the circuit. | |
| Sent | Count/rate of kilobytes sent over the circuit using transfers. | |
| Requested | Count/rate of kilobytes requested from the remote port over the circuit using request block data transfers. | |
| Block Data (Count): | ||
| Sent | Count/rate of send block data transfers over the circuit. | |
| Requested | Count/rate of block data transfer requests sent over the circuit. | |
| Datagrams: | ||
| Sent | Count/rate of SCS datagrams sent over the circuit. | |
| Received | Count/rate of SCS datagrams received on the circuit. | |
| Credit Wait | Count/rate any connection on the circuit had to wait for a send credit. | |
| Buff Desc Wait | Count/rate any connection over the circuit had to wait for a buffer descriptor. | |
You can click the handle at the beginning of an SCA data row to display the following headings when they apply to a particular node:
To display SCS connections summary data, click the handle at the beginning of the "SCS Connections" row on the Cluster Summary pane (Figure 4-1). Figure 4-5 displays SCS Connections data information.
Figure 4-5 SCS Connections Data
Table 4-5 describes the SCS connections data shown in Figure 4-5. Some of the data described in Table 4-5 is not displayed in Figure 4-5 because the screen display is wider than shown. You can scroll to the right on your terminal screen to display the remaining fields described in the table.
Note that connection count is the total number of events since the state of the connection changed to OPEN.
| Data | Description | |
|---|---|---|
| SYSAPs: | ||
| Local | Name of the SYSAP (system application) on the local system associated with the connection. | |
| Remote | Name of the SYSAP on the remote system associated with the connection. | |
| State |
The connection's current state. The possible items displayed are:
|
|
| Message Rates: | ||
| Sent | Count/rate that SCS messages are sent over the connection. | |
| Received | Count/rate that SCS messages are being received on the connection. | |
| Block Data (Kilobytes): | ||
| Mapped | Count/rate of kilobytes mapped for block data transfers by the local SYSAP using the connection. Note: This field is available only in raw data format. | |
| Sent | Number of kilobytes sent over the SCS connection by the local SYSAP using send block data transfers. | |
| Requested | Number of kilobytes requested over the SCS connection by the local SYSAP using request block data transfers. | |
| Block Data (Number): | ||
| Sent | Count/Rate of send block data transfers by this node over the SCS connection. | |
| Requested | Count/Rate of request block data transfers sent to the remote port over the SCS connection. | |
| Datagrams: | ||
| Sent | Count/Rate of datagrams sent on the SCS connection. | |
| Received | Count/Rate of datagrams received on the SCS connection. | |
| Credit Wait | Count/Rate of times the connection had to wait for a send credit. | |
| Buff Desc Wait | Count/Rate of times the connection had to wait for a buffer descriptor. | |
You can display interconnect-specific LAN virtual circuit summary data by clicking the handle at the beginning of a "LAN Virtual Circuit Summary" row to a vertical position. The screen expands to display the interconnect-specific VC summary data shown in Figure 4-6.
Figure 4-6 LAN Virtual Circuit Summary Data
Much of the data in this display corresponds to the information displayed by the SCACP command SHOW VC. The SHOW CLUSTER command does not provide a corresponding display. Which data items are displayed depends on the type of interconnect the virtual circuit is using.
Currently, this feature is available only for LAN virtual circuits. VC Summary displays for other cluster interconnects such as CI might be available in the future. When other interconnects are supported, the interconnect type will be displayed at the beginning of the line---for example, CI Virtual Circuit Summary---and the associated heading will have interconnect-specific data items.
Note that LAN Virtual Circuit counters are initialized when PEDRIVER detects the existence of a PEDRIVER on a remote system. All of a LAN VC's counters are cumulative from that time.
Some of the data described in Table 4-6 is not displayed in Figure 4-6 because the screen display is wider than shown. You can scroll to the right on your terminal screen to display the remaining fields described in the table.
Table 4-6 describes the LAN Virtual Circuit Summary data items shown in Figure 4-6.
| Data | Description | |
|---|---|---|
| VC State |
Current internal state of the virtual circuit:
|
|
| Total Errors | Number of times the virtual circuit has been closed or has had other errors. | |
| ReXmt Ratio | Ratio of total numbers of transmitted to retransmitted packets during the most recent data collection interval. | |
| Channels: | ||
| Open | Number of currently open channels available to the virtual circuit. | |
| ECS | Number of equivalent channel set (ECS) channels currently in use by the LAN virtual circuit. | |
| ECS Priority | Priority a channel must have in order to be included in the Equivalent channel set (ECS). It is the highest priority any open and tight channel has. | |
| MaxPktSiz | Maximum data buffer size in use by this LAN virtual circuit. | |
| ReXmt TMO (µsec) | Retransmission timeout, in microseconds. The length of time the virtual circuit is currently using to wait for an acknowledgment of the receipt of a packet before retransmitting that packet. | |
| XmtWindow: | ||
| Cur | Current value of the transmit window (or pipe quota). Maximum number of packets that are sent before stopping to await an acknowledgment. After a timeout, the transmit window is reset to 1 to decrease congestion; it is allowed to increase as acknowledgments are received. | |
| Max | Maximum transmit window size currently allowed for the virtual circuit. | |
| Xmt Options |
Transmit options enabled:
CKSM---packet checksumming |
|
| Packets: | ||
| Sent | Number of packets sent over this virtual circuit. | |
| Received | Number of packets received over this virtual circuit. | |
| Most recent: | ||
| Time Opened | Most recent time the virtual circuit was opened. | |
| Time Closed | Most recent time the virtual circuit was closed. | |
A LAN path or channel is a logical communication path between two LAN devices. Channels between nodes are determined by a local device, a remote device, and the connecting network. For example, two nodes, each having two devices, might establish four channels between the nodes. The packets that a particular LAN virtual circuit carries can be sent over any open channel connecting the two nodes.
The difference between channels and virtual circuits is that channels provide datagram service. Virtual circuits, layered on channels, provide error-free paths between nodes. Multiple channels can exist between nodes in an OpenVMS Cluster system, but only one LAN-based virtual circuit can exist between any two nodes at a time.
LAN channel counters are initialized when PEDRIVER detects the existence of a LAN device on a remote system. All of a LAN channel counters are cumulative from that time. For more information about channels and virtual circuits, see the HP OpenVMS Cluster Systems manual.
You can display LAN channel summary data by clicking the handle at the beginning of a "LAN Virtual Circuit Summary Data" row (Figure 4-6), or by right-clicking a data item and choosing the Channel Summary item from the shortcut menu. The screen expands to display the LAN channel summary data shown in Figure 4-6. If there is no handle at the beginning of a "LAN Virtual Circuit Summary" data row, then managed object data collection is not enabled for this SCS node.
The data items displayed depend on the type of virtual circuit. Currently, this feature is available only for LAN virtual circuits.
Some of the data described in Table 4-7 is not displayed in Figure 4-6 because the screen display is wider than shown. You can scroll to the right on your terminal screen to display the remaining fields described in the table.
| Data | Description | |
|---|---|---|
| Devices: | ||
| Local | Local LAN device associated with the channel. | |
| Remote | Remote LAN device associated with the channel. | |
| Channel State |
One of the following states:
|
|
| Total Errors | Total of various error counters for this channel (see channel details for breakdown). | |
| ECS State |
Channel ECS membership information:
Losses---one of the following:
Capacity---one of the following:
Speed---one of the following:
Note: If a channel is lossy, its capacity and speed are not always kept current. Therefore, displayed values might be those that the channel had at the time it become lossy. |
|
| Priority: | ||
| Cur | Current priority used to evaluate the channel for ECS membership. This is the sum of management priority values assigned to the LAN device. | |
| Mgmt | Dynamic management-assigned priority. | |
| Hops | Number of switches or bridges in this channel's network path to the remote LAN device. | |
| BufSiz |
Current maximum amount of SCS data that can be contained in a packet
sent over the channel. It is the smallest of the following values:
|
|
| Delay (µsec) | Running average of measured round-trip time, in microseconds, for packets sent over the channel. | |
| Load Class | Load class initialized from local and remote LAN device bit rates. | |
| Packets: | ||
| Sent | Number of packets sent on this channel, including control packets. | |
| Received | Number of packets received by this channel. | |
| Most recent: | ||
| Time Opened | Last time this channel had a verified usable path to a remote system. | |
| Time Closed | Time that this channel was last closed. | |
The following sections describe data that appears on lines that you can
open in the Cluster Members pane (Figure 4-2).
4.3.1 LAN Device Summary Data
You can display LAN device summary data by first right-clicking a node name on the Cluster Members pane. On Version 7.3 or later nodes on which managed objects are enabled, the Data Analyzer displays a menu with the following choices:
Click LAN Device Summary... to display the Device Summary Data page (Figure 4-7).
Figure 4-7 LAN Device Summary Data
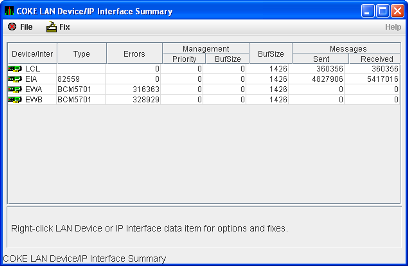
You can right-click any data item on the page to display a menu with LAN Device Fixes... on it. These fixes are explained in Chapter 6.
Table 4-8 describes the LAN device summary data displayed in Figure 4-7. This data is also displayed with SCACP command SHOW LAN_DEVICE.
| Data | Description | |
|---|---|---|
| LAN Device |
Name of the LAN device used for cluster communications between local
and remote nodes.
The icon preceding each LAN device can be one of the following colors:
A tooltip indicates the possible states a device can be in. This can be a combination of the following: Run, Online, Local, Hello _Busy, Build_Hello, Init, Wait_Mgmt, Wait_Evnt, Broken, XChain_Disabled, Delete_pend, Restart, or Restart_Delay. Alternatively, a tooltip might display "Not in use by SCA." |
|
| Type | Type of LAN device used for the cluster. | |
| Errors | Number of errors reported by the device since cluster communications began using it. | |
| Management: | ||
| Priority | Current management-assigned priority of the device. | |
| BufSize | Current management-assigned maximum buffer size of the device | |
| BufSize | Smaller of interconnect specific buffer size of the device and its current management-assigned buffer size. | |
| Messages: | ||
| Sent | Number of LAN packets sent by the device. | |
| Received | Number of packets received from remote LAN device. | |
To display LAN device detail data, right-click a LAN Path (Channel) Summary data item on the LAN Virtual Circuit Summary data page (Figure 4-6). The Data Analyzer then displays the shortcut menu shown in Figure 4-8.
Figure 4-8 LAN Path (Channel) Details Menu
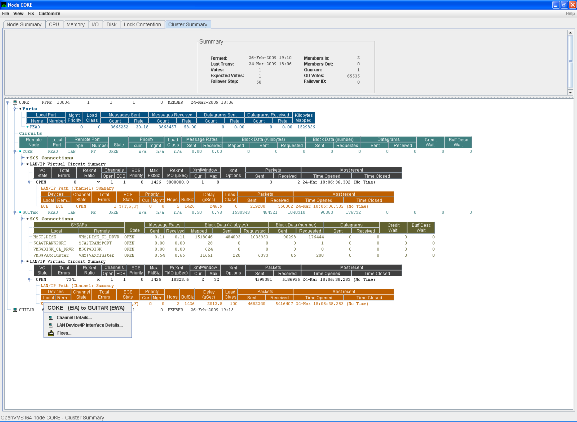
To display device details, select the LAN Device Details... item on the menu. After a brief delay, a LAN Device Overview Data page (Figure 4-9) is displayed.
A series of tabs at the top of the LAN Device Overview Data page
indicate additional LAN device pages that you can display. Much of the
LAN device detail data corresponds to data displayed by the SCACP
command SHOW LAN_DEVICE.
4.3.2.1 LAN Device Overview Data
The LAN Device Overview Data page (Figure 4-9 displays LAN device summary data.
Figure 4-9 LAN Device Overview Data
Table 4-9 describes the data displayed in Figure 4-9.
| Data | Description |
|---|---|
| Status | Device status: Run, Online, Local, Hello _Busy, Build_Hello, Init, Wait_Mgmt, Wait_Evnt, Broken, XChain_Disabled, Delete_pend, Restart, or Restart_Delay. Alternatively, "Not in use by SCA" can be displayed. |
| Device Name | Name of the LAN device. |
| Device Type | OpenVMS device type value. |
| Total Errors | Total number of errors listed on the Errors page. |
| Priority | Dynamic management-assigned priority. |
| Max Buffer Size | Maximum data buffer size for this LAN device. |
| Mgmt Buffer Size | Dynamic management-assigned maximum block data field size. |
| Load Class | Load class. The rate in MBs currently being reported by the LAN device. |
| Receive Ring Size | Number of packets the LAN device can buffer before it discards incoming packets. |
| Default LAN Address | LAN device's hardware LAN address. |
| Current LAN Address | Current LAN address being used by this LAN device. |
The LAN Device Transmit Data page (Figure 4-10) displays LAN device transmit data.
Figure 4-10 LAN Device Transmit Data
Table 4-10 describes the data displayed in Figure 4-10.
| Data | Description |
|---|---|
| Messages Sent | Number of packets sent by this bus, including multicast "Hello" packets. |
| Bytes Sent | Number of bytes in packets sent by this LAN device, including multicast "Hello" packets. |
| Multicast Msgs Sent | Number of multicast "Hello" packets sent by this LAN device. |
| Multicast Bytes Sent | Number of multicast bytes in "Hello" packets sent by this LAN device. |
| Outstanding I/O Count | Number of transmit requests being processed by LAN driver. |
The LAN Device Receive Data page (Figure 4-11) displays LAN device receive data.
Figure 4-11 LAN Device Receive Data
Table 4-11 describes the data displayed in Figure 4-11.
| Data | Description |
|---|---|
| Messages Rcvd | Number of packets received by this LAN device, including multicast packets. |
| Bytes Received | Number of bytes in packets received by this LAN device, including multicast packets. |
| Multicast Msgs Rcvd | Number of multicast NISCA packets received by this LAN device. |
| Multicast Bytes Rcvd | Number of multicast bytes received by this LAN device. |
The LAN Device Events Data page (Figure 4-12) displays LAN device events data.
Figure 4-12 LAN Device Events Data
Table 4-12 describes the data displayed in Figure 4-12.
| Data | Description |
|---|---|
| Port Usable | Number of times the LAN device became usable. |
| Port Unusable | Number of times the LAN device became unusable. |
| Address Change | Number of times the LAN device's LAN address changed. |
| Restart Failures | Number of times the LAN device failed to restart. |
| Last Event | Event type of the last LAN device event (for example, LAN address change, an error, and so on). |
| Time of Last Event | Time the last event occurred. |
The LAN Device Errors Data page (Figure 4-13) displays LAN device errors data.
Figure 4-13 LAN Device Errors Data
Table 4-13 describes the data displayed in Figure 4-13.
| Data | Description |
|---|---|
| Bad SCSSYSTEM ID | Received a packet with the wrong SCSSYSTEM ID in it. |
| MC Msgs Directed to TR Layer | Number of multicast packets directed to the NISCA Transport layer. |
| Short CC Messages Received | Number of packets received that were too short to contain a NISCA channel control header. |
| Short DX Messages Received | Number of packets received that were too short to contain a NISCA DX header. |
| CH Allocation Failures | Number of times the system failed to allocate memory for use as a channel structure in response to a packet received by this LAN device. |
| VC Allocation Failures | Number of times the system failed to allocate memory for use as a VC structure in response to a packet received by this LAN device. |
| Wrong Port | Number of packets addressed to the wrong NISCA address. |
| Port Disabled | Number of packets discarded because the LAN device was disabled. |
| H/W Transmit Errors | Number of local hardware transmit errors. |
| Hello Transmit Errors | Number of transmit errors during HELLOs. |
| Last Transmit Error Reason | Reason for last transmit error. |
| Time of Last Transmit Error | Time of last transmit error: date and time. |
To display LAN path (channel) detail data, right-click a LAN channel summary data item on the Cluster Summary page (Figure 4-6). The Data Analyzer displays a shortcut menu with the options shown in Figure 4-8.
To display LAN channel details, select the Channel Details... item on
the menu. After a brief delay, a LAN Channel Overview Data page
(Figure 4-14) is displayed. A series of tabs at the top of this page
indicate additional channel pages that you can display.
4.3.3.1 LAN Channel Overview Data
The LAN Channel Overview Data page (Figure 4-14) displays general channel data, including the state, status, and total errors of the channel.
Figure 4-14 LAN Channel Overview Data
Table 4-14 describes the data displayed in Figure 4-14.
| Data | Description |
|---|---|
| State | Channel's current state: OPEN, PATH, or CLOSED. |
| Status | Channel status. |
| Total Errors | Sum of channel's error counters. |
| Time Opened | Last time that this channel had a path to a remote system. |
| Time Closed | Last time that this channel was closed. |
| Total Time Open | Total time that this channel has been open. |
| Device Name | Local LAN device name. |
| Device Type | Local LAN device type. |
| Average RTT | Average of measured round-trip time. |
| RSVP Threshold | Number of packets before requesting that the remote node immediately return an acknowledgment. |
| Remote Ring Size | Number of entries in the remote LAN device. |
| Remote Device Type | Remote LAN device type. |
| Remote T/R Cache | Number of out-of-order packets that the remote transmit/receive resequencing cache can buffer. |
| LAN H/W Address | LAN device's hardware address. |
The LAN Channel Counters Data page (Figure 4-15) displays path counters data, including ECS transitions as well as messages and bytes sent.
Figure 4-15 LAN Channel Counters Data
Table 4-15 describes the data displayed in Figure 4-15.
| Data | Description |
|---|---|
| ECS Transitions | Number of times this channel has been in and out of the equivalent channel set (ECS). |
| Messages Sent | Number of packets sent over this channel, including control packets. |
| Bytes Sent | Number of bytes transmitted on this channel, including control packets. |
| Control Messages Sent | Number of control packets sent, not including multicast packets. |
| Control Msg Bytes Sent | Number of control packet bytes sent, not including multicast packets. |
| Messages Received | Number of packets received by this channel. |
| Bytes Received | Number of bytes in packets received by this channel. |
| MC Control Messages Rcvd | Number of multicast control packets received. |
| MC Control Msg Bytes Rcvd | Number of multicast control packets bytes received. |
| Control Messages Rcvd | Number of control packets received. |
| Control Msg Bytes Rcvd | Number of control packet bytes received. |
The LAN Channel Errors Data page (Figure 4-16) displays LAN channel errors data.
Figure 4-16 LAN Channel Errors Data
Table 4-16 describes the data displayed in Figure 4-16.
| Data | Description |
|---|---|
| Seq Retransmit | Number of times a sequenced VC packet sent on this channel was retransmitted, and the channel was penalized for the lost packet. |
| LAN Transmit Failures | Number of times the local LAN device reported a failure to transmit a packet, and channel was penalized for the lost packet. |
| Restart Channel | Close/restart because of channel control packet was received indicating the other end closed the channel and is restarting the channel handshake. |
| Channel Init Timeouts | Channel initialization handshake timeout. |
| Listen Timeouts | No packets of any kind, including HELLOs, were received in LISTEN_TIMEOUT seconds. |
| Bad Authorization Msg | Received a CC (channel control) packet with a bad authorization field. |
| Bad ECO CC Msg | Received a CC packet with an incompatible NISCA protocol ECO rev. field value. |
| Bad Multicast Msg | Received a bad multicast CC packet. |
| CC Short Packet | Received a CC packet that was too short. |
| CC Incompatible | Received a CC packet that was incompatible with existing channels for this virtual circuit. |
| Rcv Old Channel | Received a packet from an old instance of a channel. |
| No MSCP Server | No MSCP server available to respond to a received channel control solicit service packet asking this node to boot serve another node. |
| Disk Not Served | Disk is not served by this system. |
| Buffer Size Change | Change in buffer size. |
The LAN Channel Remote System Data page (Figure 4-17) displays LAN path remote system data.
Figure 4-17 LAN Channel Remote System Data
Table 4-17 describes the data displayed in Figure 4-17.
| Data | Description |
|---|---|
| Node Name | Node name of remote system. |
| Buffer Size | Buffer size (largest possible buffer size) of remote system. |
| Max Buffer Size | Current upper bound on buffer size usable on this channel. |
| Services | NISCA services supported on this channel. |
| Dev Name | Name of the remote LAN device. |
| LAN Address | Remote hardware address. |
| H/W Type | Hardware type of remote node. |
| Protocol Version | NISCA protocol version of remote system. |
The LAN Channel ECS Criteria Data page (Figure 4-18) displays equivalent channel set criteria data.
Figure 4-18 LAN Channel ECS Criteria Data
Table 4-18 describes the data displayed in Figure 4-18.
| Data | Description |
|---|---|
| ECS Membership | ECS membership status; that is, Member or Nonmember. |
| Time Entered ECS | Last time this channel entered the ECS. |
| Time Exited ECS | Last time this channel exited the ECS. |
| Total Time in ECS | Total time this channel was in the ECS. |
| Losses | Value representing channel's recent packet loss history. |
| Capacity | Channel's capacity rating based on evaluating its priority, buffer size, and hops values relative to the current ECS criteria. Values are: Ungraded, Peer, Inferior, Superior. |
| Priority | Channel's current priority for ECS calculations; it is the sum of the management priorities assigned to the local LAN device and to the channel. |
| Management Priority | Dynamic management-assigned priority. |
| Buffer Size | Negotiated maximum common buffer size: the smaller of local and remote BUS$ limits on block data field sizes. |
| Management Buffer Size | Maximum block data field size assigned by dynamic management. |
| Hops | Number of switches or bridges for this channel. |
| Management Hops | Management-supplied hops or media packet storage equivalent. |
| Speed | Classification of channel's delay relative to that of the lowest delay of any ECS member. |
| Average RTT | Average measured round-trip time. |
| Load Class | Lesser of the local and remote LAN device load class values. |
| Local Seq Number | Sequence number of the local channel. |
| Remote Seq Number | Sequence number of the remote channel. |
The Network Interconnect for System Communications Architecture (NISCA) is the transport protocol responsible for carrying packets such as disk I/Os and lock packets across Ethernet and FDDI LANs to other nodes in the cluster.
The LAN virtual circuit details (NISCA) pages show detailed information about the LAN Ethernet or FDDI connection between two nodes. The Data Analyzer displays one window for each LAN virtual circuit. This page is intended primarily to provide real-time aids for diagnosing LAN-related cluster communications problems. HP OpenVMS Cluster Systems describes the parameters shown on these pages and tells how to diagnose LAN-related cluster problems.
The LAN Virtual Circuit Details pages provide the same information as the SCACP command SHOW VC and as the following OpenVMS System Dump Analyzer (SDA) commands: PE VC and SHOW PORTS/VC=VC_ remote-node-name. In these commands, remote-node-name is the SCS name of another node in the cluster.
SDA defines VC_remote-node-name and performs the first SHOW PORTS action after SDA is started. Thus, the /CH and /VC options are valid only with the second and subsequent SHOW PORT commands.
You can display LAN virtual circuit details data by double-clicking a "LAN Virtual Circuit Summary" data row or by right-clicking a menu on the Cluster Summary page (Figure 4-6). After a brief delay, a LAN VC Transmit Data page (Figure 4-19) is displayed. The tabs at the top of the page indicate additional pages that you can display.
The data items displayed depend on the type of virtual circuit.
Currently, this feature is available only for LAN virtual circuits.
4.3.4.1 LAN VC Transmit Data
Transmit data is information about the transmission of data packets, including the numbers of packets and bytes sent. Figure 4-19 is an example of a LAN VC Transmit Data page.
Figure 4-19 LAN VC Transmit Data
Table 4-19 describes the data displayed in Figure 4-19.
| Data | Description |
|---|---|
| Packets Sent | (Raw) count and rate of packets transmitted through the virtual circuit to the remote node, including both sequenced and unsequenced (channel control) packets and lone acknowledgments. |
| Bytes Sent | (Raw) count and rate of bytes transmitted through the virtual circuit. |
| Unsequenced (DG) | (Raw) count and rate of the number of unsequenced packets that are transmitted. |
| Sequenced | (Raw) count and rate of sequenced packets transmitted. Sequenced packets are guaranteed to be delivered. |
| ReXMT Ratio | Ratio of the total number of sequenced packets sent to the current retransmission count. |
| Lone ACK | (Raw) count and rate of packets sent solely for the purpose of acknowledging receipt of one or more packets. |
| ReXMT Count | Number of packets retransmitted. Retransmission occurs when the local node does not receive an acknowledgment for a transmitted packet within a predetermined timeout interval. |
| ReXMT Timeout | Number of retransmission timeouts that have occurred. |
| Options |
Transmit options enabled:
CKSM---packet checksumming |
Receive data is information about the receipt of data packets. Figure 4-20 is an example of a LAN VC Receive Data page.
Figure 4-20 LAN VC Receive Data
Table 4-20 describes the data displayed in Figure 4-20.
| Data | Description |
|---|---|
| Packets Received | (Raw) count and rate of packets received on the virtual circuit from the remote node, including both sequenced and unsequenced---that is, datagram packets and lone acknowledgments. |
| Bytes Received | (Raw) count and rate of bytes received in packets over the virtual circuit. |
| Unsequenced (DG) | (Raw) count and rate of unsequenced---datagram---packets received. |
| Sequenced | (Raw) count and rate of sequenced packets received. |
| Lone ACK | (Raw) count and rate of lone acknowledgments received. |
| Duplicate | Number of duplicated packets received by this system. Duplicates occur when the sending node retransmits a packet, and both the original and the retransmitted packets are received. |
| Out of Order | Number of packets received out of order by this system. |
| Illegal ACK | Number of illegal acknowledgments received---that is, acknowledgments of an out-of-range sequence number. |
LAN VC congestion control data is information about LAN traffic. The values indicate the number of packets that can be sent to the remote node before receiving an acknowledgment and the retransmission timeout.
Figure 4-21 is an example of a LAN VC Congestion Control Data page. An item that is dimmed indicates that the current version of OpenVMS does not support that item.
Figure 4-21 LAN VC Congestion Control Data
Table 4-21 describes the data displayed in Figure 4-21.
| Data | Description |
|---|---|
| Transmit Window Current | Current value of the transmit window (or pipe quota). After a timeout, the pipe quota is reset to 1 to decrease network path congestion. The pipe quota is allowed to increase as quickly as acknowledgments are received. |
| Transmit Window Grow | The slow growth threshold. The size at which the increase rate of the window is slowed to avoid congestion on the network again. |
| Transmit Window Max | Maximum transmit window size currently allowed for the virtual circuit based on channel and remote PEDRIVER receive cache limitations. |
| Transmit Window Max (mgmt) | Management override to calculated value for Maximum Transmit Window size. N/A on systems prior to Version 2.0. |
| Transmit Window Reached | Number of times the entire transmit window was full. If this number is small compared with the number of sequenced packets transmitted, then either the local node is not sending large bursts of data to the remote node, or acknowledging packets are being received so promptly that the window limit is never reached. |
| Roundtrip Time |
Average round-trip time, in microseconds, for a packet to be sent and
acknowledged.
VC round trip time values are dependent on the delayed ACK or the ACKholdoff delay, that is, 100 ms. The VC trip time is also dependent on the network traffic. If there is sufficient cluster traffic, the receive window at the remote node gets filled and the ACK is delivered sooner. If the cluster is idle with no traffic, there may be a delay of 100ms to send the ACK. Hence, in an idle cluster with less traffic, the VC round trip delay value is normally high. As the traffic increases, the VC round trip time delay value drops. |
| Roundtrip Deviation |
Average deviation, in microseconds, of the round-trip time.
Deviation/Variance: Whenever a new ACK delay is measured, it is compared with the current estimate of the ACK delay. The difference is a measure of the error in the delay estimate (delayError). This delayError is used as a correction to update the current estimate of ACK delay. To prevent a "bad" measurement from estimate, the correction due to a single measurement is limited to a fraction. The average of the absolute value of the delayError from the mean is used as estimation for the delays variance. |
| Retransmit Timeout | Value, in microseconds, used to determine packet retransmission timeout. If a packet does not receive either an acknowledging or a responding packet, the packet is assumed to be lost and will be resent. |
| UnAcked Packets | Current number of unacknowledged packets. |
| CMD Queue Length | Current length of the virtual circuit's command queue. |
| CMD Queue Max | Maximum number of commands in the virtual circuit's command queue so far. |
The display of information about LAN VC channel selection depends on the version of OpenVMS and whether managed objects have been enabled. (For more information about managed objects, see the introduction to this chapter.)
Figure 4-22 is an example of a Nonmanaged Object LAN VC Channel Selection Data page.
Figure 4-22 LAN VC Channel Selection Data (Nonmanaged Objects)
Table 4-22 describes the data displayed in Figure 4-22.
| Data | Description |
|---|---|
| Buffer Size | Maximum data buffer size for this virtual circuit. |
| Channel Count | Number of channels available for use by this virtual circuit. |
| Channel Selections | Number of channel selections performed. |
| Protocol | NISCA protocol version. |
| Local Device | Name of the local LAN device that the channel uses to send and receive packets. |
| Local LAN Address | Address of the local LAN device that performs sends and receives. |
| Remote Device | Name of the remote LAN device that the channel uses to send and receive packets. |
| Remote LAN Address | Address of the remote LAN device performing the sends and receives. |
Systems running the Data Collector with managed objects enabled collect and display the following information about LAN VC Channel Selection Data. (For more information about managed objects, see the introduction to this chapter.)
An additional requirement for displaying some of the data on this data page is that managed objects be enabled on your system. For more information, see the HP Availability Manager Installation Instructions. |
Figure 4-23 is an example of a LAN VC Channel Selection Data page with managed objects enabled.
Figure 4-23 LAN VC Channel Selection Data (Managed Objects Enabled)
Table 4-23 describes the data displayed in Figure 4-23.
| Data | Description |
|---|---|
| ECS Priority | Current minimum priority a tight channel must have in order to be an ECS member. |
| Buffer Size | Maximum data buffer size for this virtual circuit. A channel must have this buffer size in order to be an ECS member. |
| Hops | Current minimum management hops a channel must have in order to be included in the ECS. |
| Channel Count | Number of channels currently available for use by this virtual circuit. |
| Channel Selections | Number of channel selections performed. |
| Protocol | Remote node's NISCA protocol version. |
| Speed Demote Threshold | Current threshold for reclassifying a FAST channel to SLOW. |
| Speed Promote Threshold | Current threshold for reclassifying a SLOW channel to FAST. |
| Min RTT | Current minimum average delay of any current ECS members. |
| Min RTT Threshold | Current threshold for reclassifying a channel as FASTER than the current set of ECS channels. |
| Mgmt Demote Threshold | A management-specified lower limit on the maximum delay (in microseconds) an ECS member channel can have. Whenever at least one tight peer channel has a delay of less than the management-supplied value, all tight peer channels with delays less than the management-supplied value are automatically included in the ECS. When all tight peer channels have delays equal to or greater than the management setting, the ECS membership delay thresholds are automatically calculated and used. |
LAN VC closures data is information about the number of times a virtual circuit has closed for a particular reason. Figure 4-24 is an example of a LAN VC Closures Data page.
An entry that is dimmed indicates that the current version of OpenVMS does not support that item.
Figure 4-24 LAN VC Closures Data
Table 4-24 describes the data displayed in Figure 4-24.
| Data | Description |
|---|---|
| No Path | Number of times the VC was closed because no usable LAN path was available. |
| SeqMsg TMO | Number of times the VC was closed because a sequenced packet's retransmit timeout count limit was exceeded. |
| Topology Change | Number of times the VC was closed because PEDRIVER performed a failover from a LAN path (or paths) with a large packet size to a LAN path with a smaller packet size. |
| CC DFQ Empty | Number of times the VC was closed because the channel control data-free queue (DFQ) was empty. |
| NPAGEDYN Low | Number of times the VC was closed because of a nonpaged pool allocation failure in the local node. |
| LAN Xmt TMO | Number of times the VC was closed because the LAN device used to send the packet did not report transmit completion before the packet's transmit timeout limit was exceeded. |
LAN VC packets discarded data is information about the number of times packets were discarded for a particular reason. Figure 4-25 is an example of a LAN VC Packets Discarded Data page.
Figure 4-25 LAN VC Packets Discarded Data
Table 4-25 describes the data displayed in Figure 4-25.
| Data | Description |
|---|---|
| Bad Checksum | Number of times there was a checksum failure on a received packet. |
| No Xmt Chan | Number of times no transmit channel was available. |
| Rcv Short Msg | Number of times an undersized transport packet was received. |
| Ill Seq Msg | Number of times an out-of-range sequence numbered packet was received. |
| TR DFQ Empty | Number of times the transmit data-free queue (DFQ) was empty. |
| TR MFQ Empty | Number of times the TR layer message-free queue (MFQ) was empty. |
| CC MFQ Empty | Number of times the channel control MFQ was empty. |
| Rcv Window Miss | Number of packets that could not be placed in the virtual circuit's receive cache because the cache was full. |
Before you start this chapter, be sure to read the explanations of data collection, events, thresholds, and occurrences in Chapter 1. |
The Availability Manager Data Analyzer indicates resource availability problems in the Event pane (Figure 5-1) of the main System Overview window (Figure 1-1).
Figure 5-1 OpenVMS Event Pane
The Event pane helps you identify system problems. In many cases, you can apply fixes to correct these problems as well, as explained in Chapter 6.
The Data Analyzer displays a warning message in the Event pane whenever
it detects a resource availability problem. If logging is enabled (the
default), the Data Analyzer also logs each event in the Event Log file,
which you can display or print. (For the location of this file and a
cautionary note about it, see Section 5.2.)
5.1 Event Information Displayed in the Event Pane
The Data Analyzer can display events for all nodes that are currently in communication with the Data Analyzer. When an event of a certain severity occurs, the Data Analyzer adds the event to a list in the Event pane.
The length of time an event is displayed depends on the severity of the event. Less severe events are displayed for a short period of time (30 seconds); more severe events are displayed until you explicitly remove the event from the Event pane (explained in Event Pane Menu Options).
Table 5-1 provides additional information about the data items that are displayed in the Event pane.
| Data Item | Description |
|---|---|
| Node | Name of the node causing the event |
| Group | Group of the node causing the event |
| Date | Date the event occurred |
| Time | Time that an event was detected |
| Sev | Severity: a value from 0 to 100. (You can customize this value to indicate the importance of the event, with 100 as the most important.) |
| Event | Alphanumeric identifier of the type of event |
| Description | Short description of the resource availability problem |
Appendix B contains tables of events that are displayed in the Event pane. In addition, these tables contain an explanation of each event and the recommended remedial action.
When you right-click a node name or data item in the Event pane, the Data Analyzer displays a shortcut menu with the following options:
| Menu Option | Description |
|---|---|
| Display | Displays the Node Summary page associated with that event. |
| Remove | Removes an event from the display. |
| Freeze/Unfreeze | Freezes a value in the display until you "unfreeze" it; a snowflake icon is displayed to the left of an event that is frozen. |
| Customize | Allows you to customize events. |
During data collection, any time data meets or exceeds the threshold for an event, an occurrence counter is incremented. When the incremented value matches the value in the Occurrence box on the Event Customization page (Figure 5-2), the event is posted in the Event pane of the System Overview window (Figure 1-1).
Figure 5-2 Sample Event Customization
The sample Event Customization page indicates a threshold of 15 errors and an occurrence value of 2. This means that if the DSKERR event exceeds its threshold of 15 for two consecutive data collections, the DSKERR event is posted in the Event pane.
Note that some events are triggered when data is lower than the threshold; other events are triggered when data is higher than the threshold.
If, at any time during data collection, the data does not meet or exceed the threshold, the occurrence counter is set to zero, and the event is removed from the Event pane. Figure 5-3 depicts this sequence.
Figure 5-3 Testing for Events
When an event is posted, the following actions occur:
Figure 5-4 OpenVMS Data Collection Customization
Figure 5-5 OpenVMS Group/Node Pane
When an event is posted, the following actions also occur:
AMDS$AM_LOG:ANALYZEREVENTS_CONNi_yyyymmdd-hhmm.LOG
|
| Event Column | Description | ||||||||||||
|---|---|---|---|---|---|---|---|---|---|---|---|---|---|
| Group name | AMDS Group name | ||||||||||||
| Node | Node name for the OpenVMS system | ||||||||||||
| Date/Time | The date and time for the Event Log entry | ||||||||||||
| Severity | Severity of the event | ||||||||||||
| Event | Alphanumeric event identifier | ||||||||||||
| EventKey | A hex value identifying an event for a node. For instance, all HINTER events for a node have the same value. Each time the HINTER event is signaled for a node, the value will be the same, making it easy to search for all the HINTER events for a node. | ||||||||||||
| EventID | A hex value identifying an individual event. For instance, if the HICOMQ event on node SAM is signaled, the BEGIN and END/CANCELD/EXPIRED entries that mark when the event was signaled and cancelled will have the same value. The next time the HICOMQ event is signaled on node SAM, the hex value will be different. This value makes it easy to find the entry that signals when the event has been cancelled. | ||||||||||||
| Status |
The value describes the status of the event. Values are as follows:
|
||||||||||||
| Description | Event description |
If you collect data on many nodes, running the Data Analyzer for a long period of time can result in a large event log. For example, in a run that monitors more than 50 nodes with most of the background data collection enabled, the event log can grow by up to 30 MB per day. At this rate, systems with small disks might fill up the disk on which the event log resides. Closing the Data Analyzer application allows you to access the event log for tasks such as archiving. Starting the Data Analyzer starts a new event log. |
For more detailed information about a specific event, double-click any event data item in the Event pane. The Data Analyzer first displays a data page that most closely corresponds to the cause of the event. You can choose other tabs for additional detailed information.
For a description of data pages and the information they contain, see Chapter 3.
| Previous | Next | Contents | Index |