The Data Analyzer displays these Process tabs:
Process General
Process Memory
Process Limits
Figure 6-3 Process General Options

| Previous | Contents | Index |
Fixes allow you to resolve resource availability problems and improve system availability.
This chapter discusses the following topics:
Performing certain fixes can have serious repercussions, including possible system failure. Therefore, only experienced system managers should perform fixes. |
When you suspect or detect a resource availability problem, in many cases you can use the Availability Manager Data Analyzer to analyze the problem and to perform a fix to improve the situation.
Data Analyzer fixes fall into the following categories:
You can access fixes, by category, from the pages listed in Table 6-1.
| Fix Category and Name | Available from This Page |
|---|---|
Node fixes:
Crash Node |
Node Summary
CPU Memory Summary I/O Process SCA Port SCA Circuit LAN Virtual Circuit LAN Path (Channel) LAN Device |
Process fixes:
General process fixes:Delete Process |
All of the process fixes are available from the following pages:
Memory Summary |
Disk fixes:
Cancel disk MV |
All of the disk fixes are available from the following pages:
Disk Status Summary |
| Cluster interconnect fixes: | These fixes are available from the following lines of data on the Cluster Summary page (Figure 4-1): |
| - SCA Port:/ Adjust Priority | Right-click a data item on the Local Port Data display line to display a menu. Then select Port Fix.... |
| - SCA Circuit:/ Adjust Priority | Right-click a data item on the Circuits Data display line to display a menu. Then select Circuit Fix.... |
LAN Virtual Circuit Summary:
Maximum Transmit Window Size |
Right-click a data item on the LAN Virtual Circuit Summary line to display a menu. Then select VC LAN Fix.... Alternatively, you can use the Fix menu on the LAN VC Details page. |
LAN Path (Channel) Summary:
Adjust Priority |
Right-click a data item on the LAN Path (Channel) Summary line to display a menu. Then select Fixes.... Alternatively, you can use the Fix menu on the Channel Details page. |
LAN Device Details:
Adjust Priority |
You can access these fixes in the following ways:
|
Table 6-2 summarizes various problems, recommended fixes, and the expected results of fixes.
| Problem | Fix | Result |
|---|---|---|
| Node resource hanging cluster | Crash Node | Node fails with operator-requested shutdown. See Section 6.2.2 for the crash dump footprint for this type of shutdown. |
| Cluster hung | Adjust Quorum | Quorum for cluster is adjusted. |
| Process looping, intruder | Delete Process | Process no longer exists. |
| Endless process loop in same PC range | Exit Image | Exits from current image. |
| Runaway process, unwelcome intruder | Suspend Process | Process is suspended from execution. |
| Process previously suspended | Resume Process | Process starts from point it was suspended. |
| Runaway process or process that is overconsuming | Process Priority | Base priority changes to selected setting. |
| Low node memory | Purge Working Set (WS) | Frees memory on node; page faulting might occur for process affected. |
| Working set too high or low | Adjust Working Set (WS) | Removes unused pages from working set; page faulting might occur. |
| Process quota has reached its limit and has entered RWAIT state | Adjust Process Limits | Process limit is increased, which in many cases frees the process to continue execution. |
| Process has exhausted its pagefile quota | Adjust Pagefile Quota | Pagefile quota limit of the process is adjusted. |
| Disk volume is in mount verify state | Cancel disk MV | Disk volume is taking out of the mount verify state and put into the mount verify timeout state. The disk can now be dismounted with the $ DISMOUNT/ABORT command. |
| Shadow set is in mount verify state due to a shadow set member being in a mount verify state | Cancel SSM MV | The shadow set member is ejected from the shadow set, enabling the shadow set to return to a mounted state. This is equivalent to $ SET SHADOW/FORCE_REMOVAL command. |
Most process fixes correspond to an OpenVMS system service call, as shown in the following table:
| Process Fix | System Service Call |
|---|---|
| Delete Process | $DELPRC |
| Exit Image | $FORCEX |
| Suspend Process | $SUSPND |
| Resume Process | $RESUME |
| Process Priority | $SETPRI |
| Purge Working Set (WS) | $PURGWS |
| Adjust Working Set (WS) | $ADJWSL |
Adjust process limits of the following:
Direct I/O (DIO) |
None |
Each fix that uses a system service call requires that the process execute the system service. A hung process has the fix queued to it, and the fix does not execute until the process is operational again. |
Be aware of the following facts before you perform a fix:
Standard OpenVMS privileges restrict users' write access. When you run the Data Analyzer, you must have the CMKRNL privilege to send a write (fix) instruction to a node with a problem.
The following options are displayed at the bottom of all fix pages:
| Option | Description |
|---|---|
| OK | Applies the fix and then exits the page. Any message associated with the fix is displayed in the Event pane. |
| Cancel | Cancels the fix. |
| Apply | Applies the fix and does not exit the page. Any message associated with the fix is displayed in the Return Status section of the page and in the Event pane. |
The following sections explain how to perform node, process and disk fixes.
Node, process and disk fixes generate an event when they are executed. The events are entered into the event log on the system that is running the Data Analyzer. See the "Events generated by fixes" section in Table C-2 for a list of these events. |
Node fixes fall into the following categories:
To perform a node fix, follow these steps:
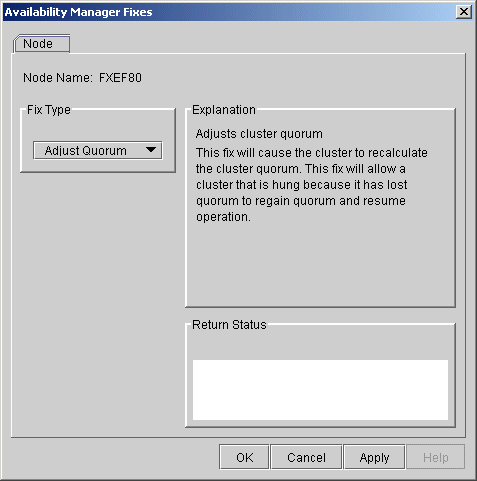
6.2.1 Adjust Quorum
The default node fix displayed is the Adjust Quorum fix, which forces a
node to recalculate the quorum value. This fix is the equivalent of the
Interrupt Priority level C (IPC) mechanism used at system consoles for
the same purpose. The fix forces the adjustment for the entire cluster
so that each node in the cluster has the same new quorum value.
The Adjust Quorum fix is useful when the number of votes in a cluster falls below the quorum set for that cluster. This fix allows you to readjust the quorum so that it corresponds to the current number of votes in the cluster.
The Adjust Quorum page is shown in Figure 6-1.
Figure 6-1 Adjust Quorum
The Crash Node fix is an operator-requested bugcheck from the Data Collector. It takes place as soon as you click OK in the Crash Node fix. After you perform this fix, the node cannot be restored to its previous state. After a crash, the node must be rebooted. |
When you select the Crash Node option, the Data Analyzer displays the Crash Node page, shown in Figure 6-2.
Figure 6-2 Crash Node
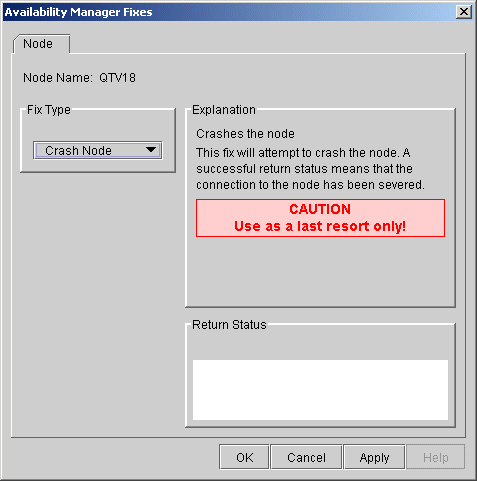
Because the node cannot report a confirmation when a Crash Node fix is successful, the crash success message is displayed after the timeout period for the fix confirmation has expired. |
Recognizing a System Failure Forced by the Availability Manager
Because a user with suitable privileges can force a node to fail from the Data Analyzer by using the Crash Node fix, system managers have requested a method for recognizing these particular failure footprints so that they can distinguish them from other failures. These failures all have identical footprints: they are operator-induced system failures in kernel mode at IPL 8. The top of the kernel stack is similar the following display:
                SP => Quadword system address
                      Quadword data
                      1BE0DEAD.00000000
                      00000000.00000000
                      Quadword data            TRAP$CRASH
                      Quadword data            SYS$RMDRIVER + offset
|
. Process fixes fall into the following categories:
To perform a process fix, follow these steps:
Process General
Process Memory
Process Limits
Figure 6-3 Process General Options

Some of the fixes, such as Process Priority, require you to use a slider to change the default value. When you finish setting a new process priority, click Apply at the bottom of the page to apply that fix.
6.3.1 General Process Fixes
The following sections describe Data Analyzer general process fixes.
These fixes include instructions telling how to delete, suspend, and
resume a process.
6.3.1.1 Delete Process
In most cases, a Delete Process fix deletes a process. However, if a process is waiting for disk I/O or is in a resource wait state (RWAST), this fix might not delete the process. In this situation, it is useless to repeat the fix. Instead, depending on the resource the process is waiting for, a Process Limit fix might free the process. As a last resort, reboot the node to delete the process.
Deleting a system process can cause the system to hang or become unstable. |
When you select the Delete Process option, the Data Analyzer displays the page shown in Figure 6-4.
Figure 6-4 Delete Process
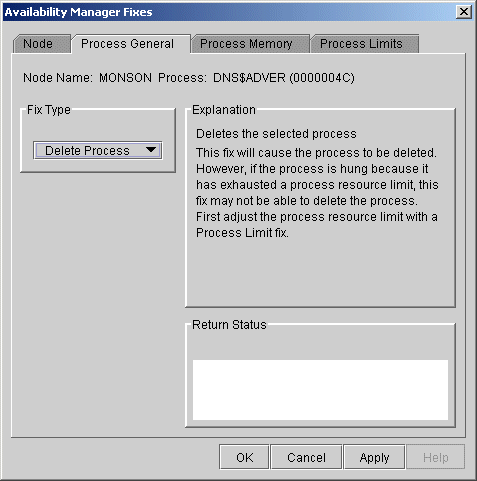
After reading the explanation, click Apply at the bottom of the page to apply the fix. A message displayed on the page indicates that the fix has been successful.
6.3.1.2 Exit Image
Exiting an image on a node can stop an application that a user
requires. Make sure you check the Single Process page before you exit
an image to determine which image is running on the node.
Exiting an image on a system process could cause the system to hang or become unstable. |
When you select the Exit Image option, the Data Analyzer displays the page shown in Figure 6-5.
Figure 6-5 Exit Image Page
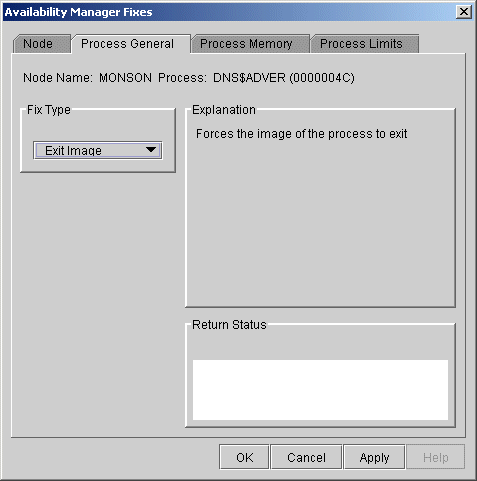
After reading the explanation in the page, click Apply at the bottom of the page to apply the fix. A message displayed on the page indicates that the fix has been successful.
6.3.1.3 Suspend Process
Suspending a process that is consuming excess CPU time can improve
perceived CPU performance on the node by freeing the CPU for other
processes to use. (Conversely, resuming a process that was using excess
CPU time while running might reduce perceived CPU performance on the
node.)
Do not suspend system processes, especially JOB_CONTROL, because this might make your system unusable. (For more information, see HP OpenVMS Programming Concepts Manual, Volume I.) |
When you select the Suspend Process option, the Data Analyzer displays the page shown in Figure 6-6.
Figure 6-6 Suspend Process
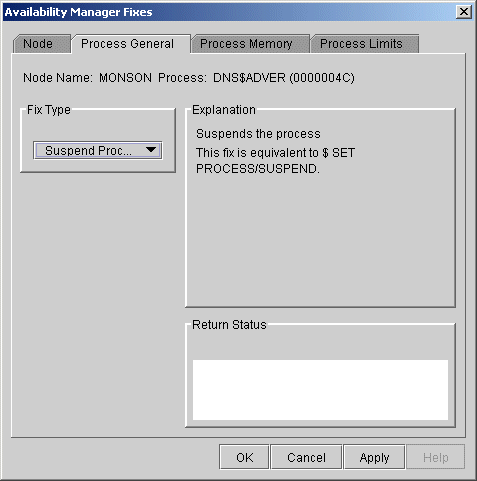
After reading the explanation, click Apply at the bottom of the page to apply the fix. A message displayed on the page indicates that the fix has been successful.
6.3.1.4 Resume Process
Resuming a process that was using excess CPU time while running might
reduce perceived CPU performance on the node. (Conversely, suspending a
process that is consuming excess CPU time can improve perceived CPU
performance by freeing the CPU for other processes to use.)
When you select the Resume Process option, the Data Analyzer displays the page shown in Figure 6-7.
Figure 6-7 Resume Process

After reading the explanation, click Apply at the bottom of the page to apply the fix. A message displayed on the page indicates that the fix has been successful.
6.3.1.5 Process Priority
If the priority of a compute-bound process is too high, the process can
consume all the CPU cycles on the node, affecting performance
dramatically. On the other hand, if the priority of a process is too
low, the process might not obtain enough CPU cycles to do its job, also
affecting performance.
When you select the Process Priority option, the Data Analyzer displays the page shown in Figure 6-8.
Figure 6-8 Process Priority
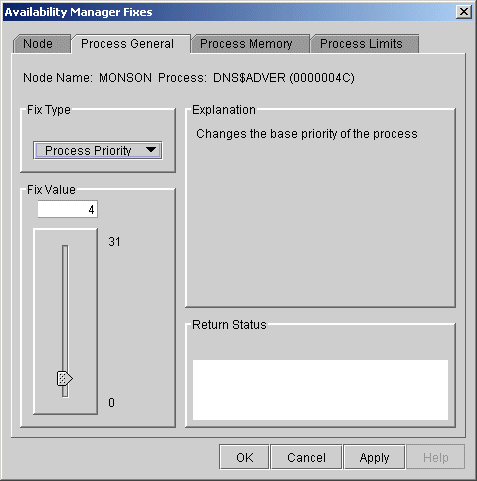
To change the base priority for a process, drag the slider on the scale to the number you want. The current priority number is displayed in a small box above the slider. You can also click the line above or below the slider to adjust the number by 1.
When you are satisfied with the new base priority, click Apply at the bottom of the page to apply the fix. A message displayed on the page indicates that the fix has been successful.
6.3.2 Process Memory Fixes
The following sections describe the Availability Manager fixes you can
use to correct process memory problems--- Purge Working Set and Adjust
Working Set fixes.
6.3.2.1 Purge Working Set
This fix purges the working set to a minimal size. You can use this fix to reclaim a process's pages that are not in active use. If the process is in a wait state, the working set remains at a minimal size, and the purged pages become available for other uses. If the process becomes active, pages the process needs are page-faulted back into memory, and the unneeded pages are available for other uses.
Be careful not to repeat this fix too often: a process that continually reclaims needed pages can cause excessive page faulting, which can affect system performance.
When you select the Purge Working Set option, the Data Analyzer displays the page shown in Figure 6-9.
Figure 6-9 Purge Working Set
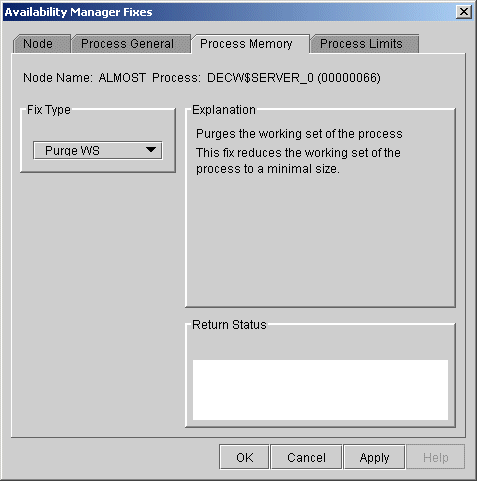
After reading the explanation on the page, click Apply at the bottom of the page to apply the fix. A message displayed on the page indicates that the fix has been successful.
6.3.2.2 Adjust Working Set
Adjusting the working set of a process might prove to be useful in a
variety of situations. Two of these situations are described in the
following list.
If the automatic working set adjustment is enabled for the system, a fix to adjust the working set size disables the automatic adjustment for the process. For more information, see OpenVMS online help for SET WORKING_SET/ADJUST, which includes /NOADJUST. |
When you select the Adjust Working Set fix, the Data Analyzer displays the page shown in Figure 6-10.
Figure 6-10 Adjust Working Set
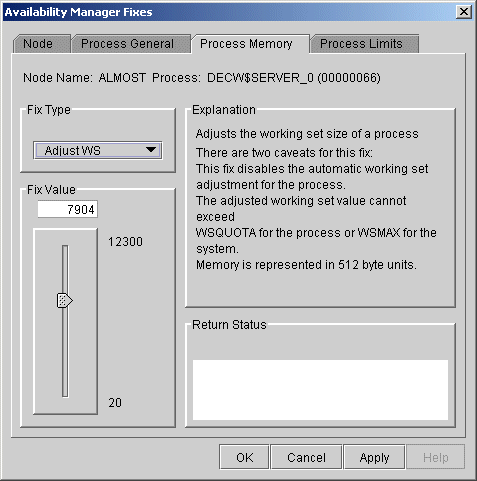
To perform this fix, use the slider to adjust the working set to the limit you want. You can also click the line above or below the slider to adjust the number by 1.
When you are satisfied with the new working set limit, click Apply at the bottom of the page to apply the fix. A message displayed on the page indicates that the fix has been successful.
6.3.3 Process Limits Fixes
If a process is waiting for a resource, you can use a Process Limits
fix to increase the resource limit so that the process can continue.
The increased limit is in effect only for the life of the process,
however; any new process is assigned the quota that was set in the UAF.
When you click the Process Limits tab, you can select any of the following options:
Direct I/O
Buffered I/O
AST
Open File
Lock
Timer
Subprocess
I/O Byte
Pagefile Quota
These fix options are described in the following sections.
6.3.3.1 Direct I/O Count Limit
You can use this fix to adjust the direct I/O count limit of a process. When you select the Direct I/O option, the Data Analyzer displays the page shown in Figure 6-11.
Figure 6-11 Direct I/O Count Limit
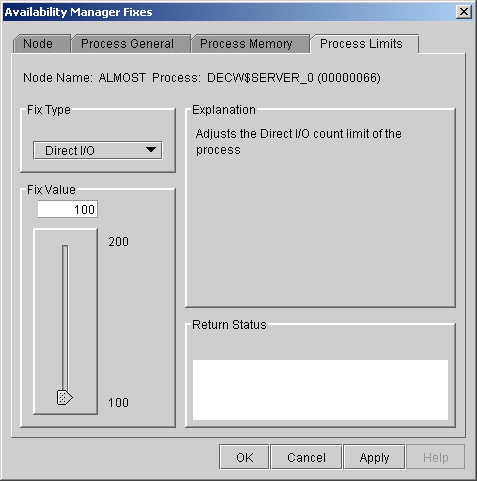
To perform this fix, use the slider to adjust the direct I/O count to the limit you want. You can also click the line above or below the slider to adjust the number by 1.
When you are satisfied with the new direct I/O count limit, click Apply at the bottom of the page to apply the fix. A message displayed on the page indicates that the fix has been successful.
6.3.3.2 Buffered I/O Count Limit
You can use this fix to adjust the buffered I/O count limit of a
process. When you select the Buffered I/O option, the Data Analyzer
displays the page shown in Figure 6-12.
Figure 6-12 Buffered I/O Count Limit
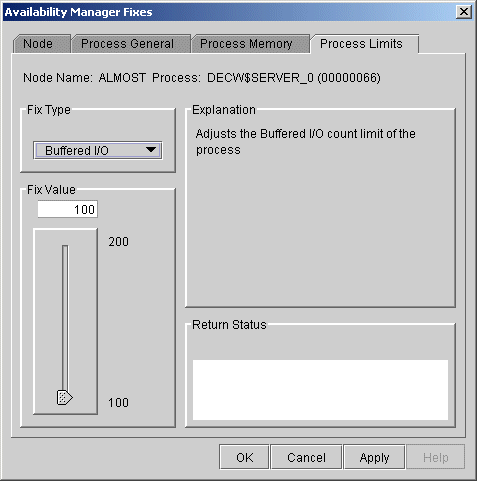
To perform this fix, use the slider to adjust the buffered I/O count to the limit you want. You can also click the line above or below the slider to adjust the number by 1.
When you are satisfied with the new buffered I/O count limit, click Apply at the bottom of the page to apply the fix. A message displayed on the page indicates that the fix has been successful.
6.3.3.3 AST Queue Limit
You can use this fix to adjust the AST queue limit of a process. When
you select the AST option, the Data Analyzer displays a page similar to
the one shown in Figure 6-13.
Figure 6-13 AST Queue Limit
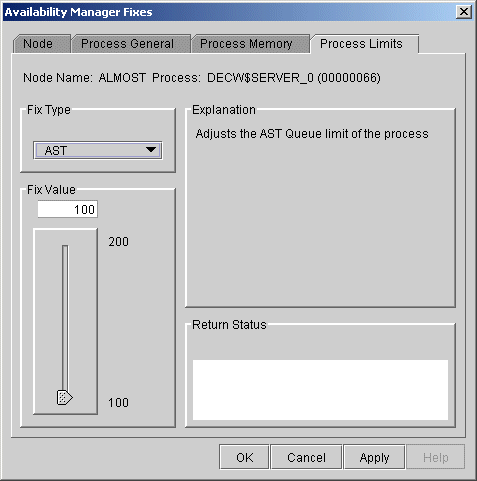
To perform this fix, use the slider to adjust the AST queue limit to the number you want. You can also click the line above or below the slider to adjust the number by 1.
When you are satisfied with the new AST queue limit, click Apply at the bottom of the page to apply the fix. A message displayed on the page indicates that the fix has been successful.
6.3.3.4 Open File Limit
You can use this fix to adjust the open file limit of a process. When
you select the Open File option, the Data Analyzer displays a page
similar to the one shown in Figure 6-14.
Figure 6-14 Open File Limit
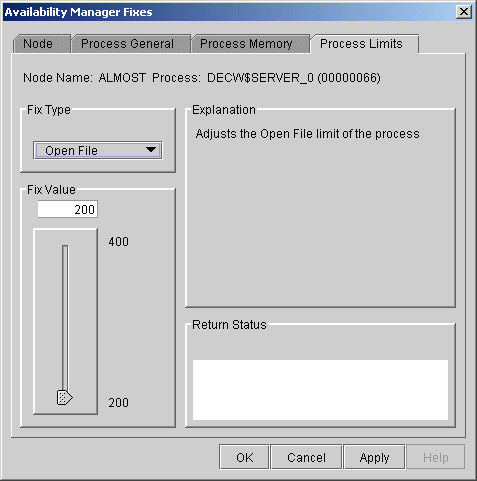
To perform this fix, use the slider to adjust the open file limit to the number you want. You can also click the line above or below the slider to adjust the number by 1.
When you are satisfied with the new open file limit, click Apply at the bottom of the page to apply the fix. A message displayed on the page indicates that the fix has been successful.
6.3.3.5 Lock Queue Limit
You can use this fix to adjust the lock queue limit of a process. When
you select the Lock option, the Data Analyzer displays a page that is
similar to the one shown in Figure 6-15.
Figure 6-15 Lock Queue Limit

To perform this fix, use the slider to adjust the lock queue limit to the number you want. You can also click the line above or below the slider to adjust the number by 1.
When you are satisfied with the new lock queue limit, click Apply at the bottom of the page to apply the fix. A message displayed on the page indicates that the fix has been successful.
6.3.3.6 Timer Queue Entry Limit
You can use this fix to adjust the timer queue entry limit of a
process. When you select the Timer option, the Data Analyzer displays
the page shown in Figure 6-16.
Figure 6-16 Timer Queue Entry Limit
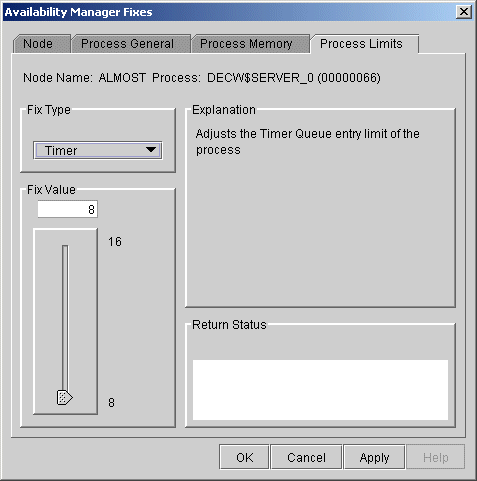
To perform this fix, use the slider to adjust the timer queue entry limit to the number you want. You can also click the line above or below the slider to adjust the number by 1.
When you are satisfied with the new timer queue entry limit, click Apply at the bottom of the page to apply the fix. A message displayed on the page indicates that the fix has been successful.
6.3.3.7 Subprocess Creation Limit
You can use this fix to adjust the creation limit of the subprocess of
a process. When you select the Subprocess option, the Data Analyzer
displays the page shown in Figure 6-17.
Figure 6-17 Subprocess Creation Limit
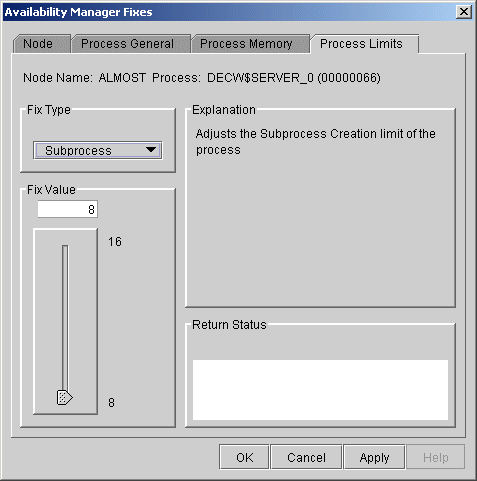
To perform this fix, use the slider to adjust the subprocess creation limit of a process to the number you want. You can also click the line above or below the slider to adjust the number by 1.
When you are satisfied with the new subprocess creation limit, click Apply at the bottom of the page to apply the fix. A message displayed on the page indicates that the fix has been successful.
6.3.3.8 I/O Byte
You can use this fix to adjust the I/O byte limit of a process. When
you select the I/O Byte option on the movable bar, the Data Analyzer
displays a page similar to the one shown in Figure 6-18.
Figure 6-18 I/O Byte
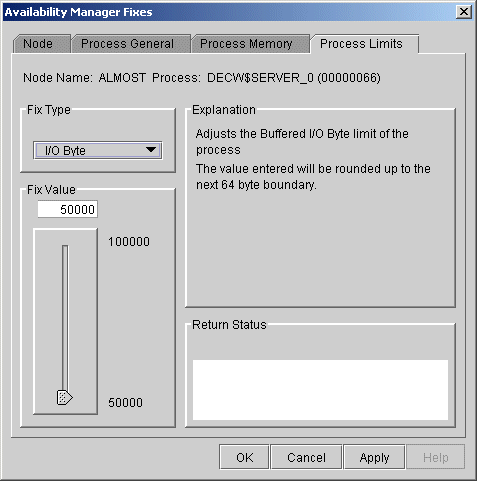
To perform this fix, use the slider to adjust the I/O byte limit to the number you want. You can also click the line above or below the slider to adjust the number by 1.
When you are satisfied with the new I/O byte limit, click Apply at the bottom of the page to apply the fix. A message displayed on the page indicates that the fix has been successful.
6.3.3.9 Pagefile Quota
You can use this fix to adjust the pagefile quota limit of a process.
This quota is share among all the processes in a job and is measured in
pagelets (512 byte pages). When you select the Pagefile Quota option,
the Data Analyzer displays the page shown in Figure 6-19.
Figure 6-19 Pagefile Quota
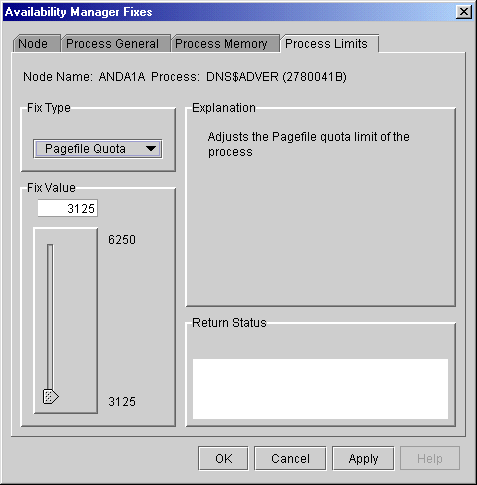
To perform this fix, use the slider to adjust the pagefile quota limit to the number you want. You can also click above or below the slider to adjust the fix value by 1 on VAX systems, or by the number of pagelets in a page for Alpha and I64 systems.
When you are satisfied with the new pagefile quota limit, click Apply at the bottom of the page to apply the fix. A message displayed on the page indicates that the fix has been successful.
6.4 Performing Disk Fixes
Disk fixes fall into the following categories:
To perform a node fix, follow these steps:
6.4.1 Cancel Disk Volume Mount Verification
The default disk fix displayed is the Cancel Disk Mount Verification
(MV) fix, which forces a disk volume that is in a mount verify state
into a mount verify timeout state. This fix is the equivalent of the
Interrupt Priority level C (IPC) mechanism used at system consoles for
the same purpose.
The Cancel Disk Mount Verification (MV) fix is useful where disk volumes are mounted cluster-wide, and the host node for the disk volume fails. Once this fix is used on a disk volume, the disk then can be dismounted with a $ DISMOUNT/ABORT command.
The Cancel Disk MV page is shown in Figure 6-20.
Figure 6-20 Cancel Disk MV
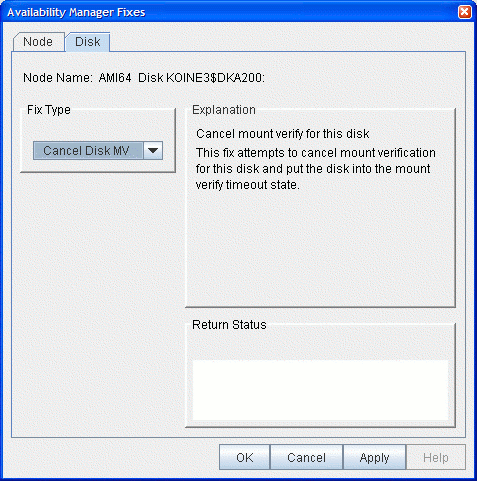
After reading the explanation on the page, click Apply at the bottom of the page to apply the fix. A message displayed on the page indicates that the fix has been successful.
6.4.2 Cancel Shadow Set Mount Verification
The Cancel Shadow Set Mount Verification (SSM MV) fix forces the
ejection of an unavailable shadow set member from a shadow set that is
in a mount verify state.
The Cancel SSM MV fix is useful to regain use of a shadow set that is in a mount verify state because a shadow set member resides on a host node that has failed. This is especially useful where the shadow set contains the System Authorization file, and having the shadow set in a mount verify state prevents logins to the node or cluster.
This fix is the equivalent to the $ SET SHADOW/FORCE_REMOVAL command.
The Cancel SSM MV page is shown in Figure 6-21.
Figure 6-21 Cancel SSM MV
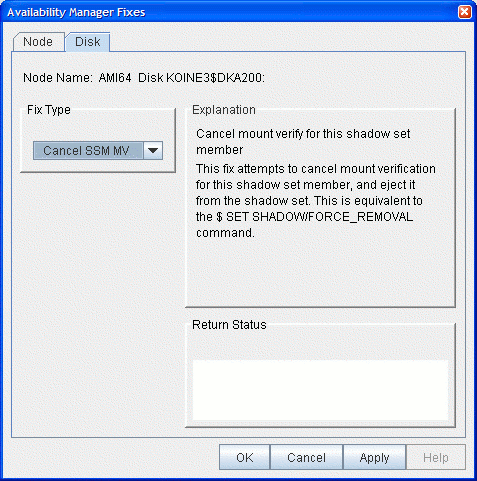
After reading the explanation on the page, click Apply at the bottom of the page to apply the fix. A message displayed on the page indicates that the fix has been successful.
6.5 Performing Cluster Interconnect Fixes
All cluster interconnect fixes require that managed objects be enabled. |
The following are categories of cluster interconnect fixes:
The following sections describe these types of fixes. The descriptions also indicate whether or not the fix is currently available.
6.5.1 Port Adjust Priority Fix
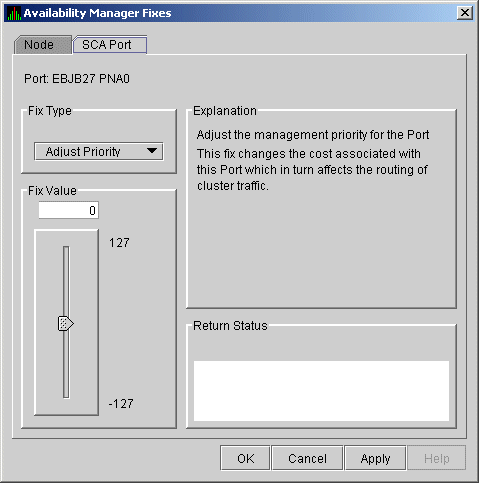
To access the Port Adjust Priority fix, right-click a data item in the
Local Port Data display line (see Figure 4-3). The Data Analyzer
displays a shortcut menu with the Port Fix option.
This page (Figure 6-22) allows you to change the cost associated with this port, which, in turn, affects the routing of cluster traffic.
Figure 6-22 Port Adjust Priority
6.5.2 Circuit Adjust Priority Fix
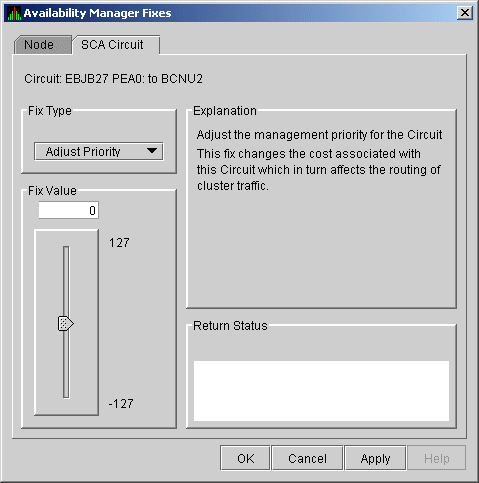
To access the Circuit Adjust Priority fix, right-click a data item in
the circuits data display line (see Figure 4-4). The Data Analyzer
displays a shortcut menu with the Circuit Fix option.
This page (Figure 6-23) allows you to change the cost associated with this circuit, which, in turn, affects the routing of cluster traffic. In the below text figures 6-23 to 6-34 on a Cluster Over IP interface would be updated in the next Documentation update.
Figure 6-23 Circuit Adjust Priority
6.5.3 LAN Virtual Circuit Fixes
To access LAN virtual circuit fixes, right-click a data item in the LAN
Virtual Circuit Summary category (see Figure 4-6), or use the Fix
menu on the LAN Device Details... page.
The Data Analyzer displays a shortcut menu with the following options:
When you select VC LAN Fix..., the Data Analyzer displays the first of several fix pages. Use the Fix Type box to select one of the following LAN VC fixes:
These fixes are described in the following sections.
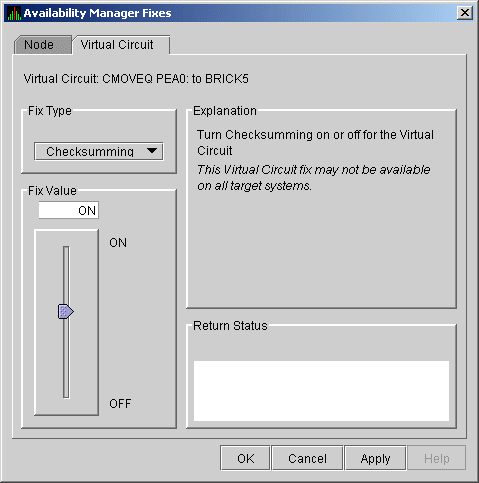
6.5.3.1 LAN VC Checksumming Fix
The LAN VC Checksumming fix (Figure 6-24) allows you to turn checksumming on or off for the virtual circuit.
Figure 6-24 LAN VC Checksumming
6.5.3.2 LAN VC Maximum Transmit Window Size Fix
The LAN VC Transmit Window Size fix (Figure 6-25) allows you to
adjust the maximum transmit window size for the virtual circuit.
Figure 6-25 LAN VC Maximum Transmit Window Size

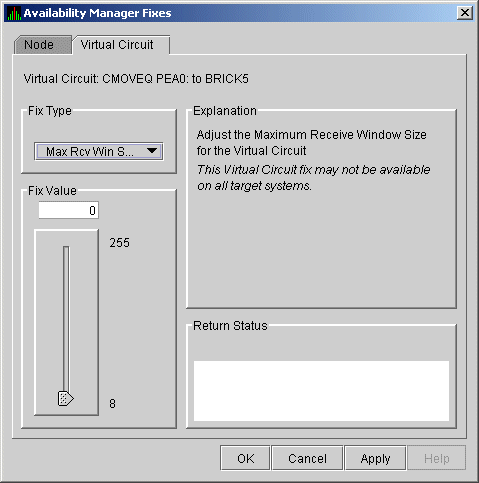
6.5.3.3 LAN VC Maximum Receive Window Size Fix
The LAN VC Maximum Receive Window Size fix (Figure 6-26) allows you
to adjust the maximum receive window size for the virtual circuit.
Figure 6-26 LAN VC Maximum Receive Window Size
6.5.3.4 LAN VC Compression Fix
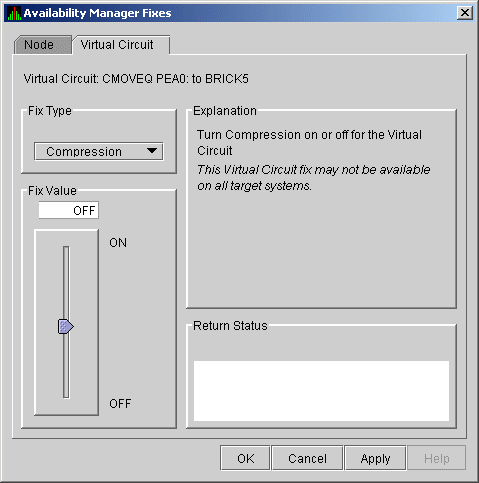
The LAN VC Compression fix (Figure 6-27) allows you to turn
compression on or off for the virtual circuit. This fix, however, might
not be available on all target systems.
Figure 6-27 LAN VC Compression
6.5.3.5 LAN VC ECS Maximum Delay Fix
The LAN VC ECS Maximum Delay fix (Figure 6-28) sets a
management-specific limit on the maximum delay (in microseconds) an ECS
member channel can have. You can set a value between 0 and 3000000.
Zero disables a prior management delay setting.
You can use this fix to override PEdriver automatically calculated delay thresholds. This ensures that all channels with delays less than the value supplied are included in the VC's ECS.
Figure 6-28 LAN VC ECS Maximum Delay
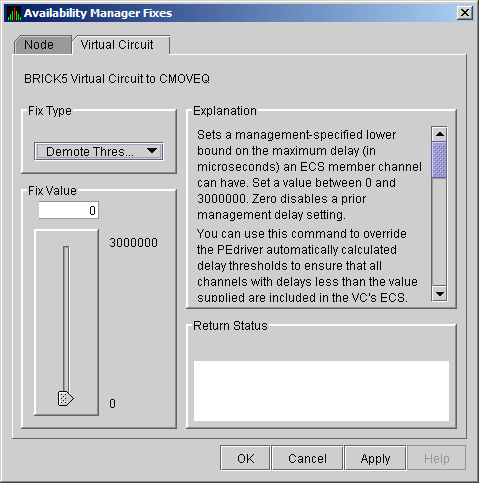
On the sample page shown in Figure 6-28, you cannot read the following text (which is displayed when you move the slider down): "The fix operates as follows: Whenever at least none tight peer channel has a delay of less than the management-supplied value, all tight peer channels with delays less than the management-supplied value are automatically included in the ECS. When all tight peer channels have delays equal to or greater than the management setting, the ECS membership delay thresholds are automatically calculated and used.
You must determine an appropriate value for your configuration by experimentation. An initial value of 2000 (2ms) to 5000 (5ms) is suggested."
On this page, the following note of caution is also displayed:
By overriding the automatic delay calculations, you can include a channel in the ECS whose average delay is consistently greater than 1.5 to 2 times the average delay of the fastest channels. When this occurs, the overall VC throughput becomes the speed of the slowest ECS member channel. An extreme example is when the management delay permits a 10Mb/sec Ethernet channel to be included with multiple 1Gb/sec channels. The resultant VC throughput drops to 10Mb/sec. |
To access LAN path fixes, right-click an item on a LAN Path (Channel) Summary line (see Figure 4-6). The Data Analyzer displays a shortcut menu with the following options:
Click Fixes... or use the Fix menu on the Channel Details page. The Data Analyzer displays a page with the following Fix Types:
These fixes are described in the following sections.
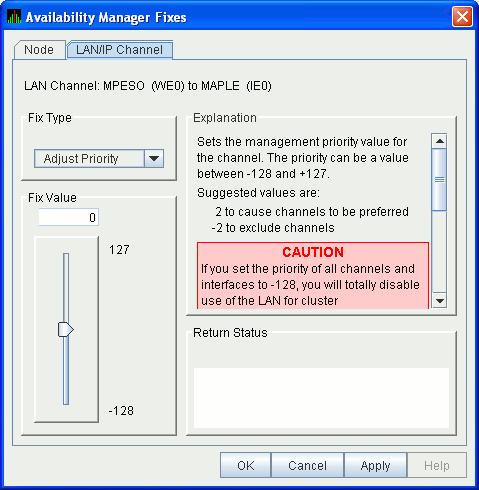
6.5.4.1 LAN Path (Channel) Adjust Priority Fix
The LAN Path (Channel) Adjust Priority fix (Figure 6-29) allows you
to change the cost associated with this channel by adjusting its
priority. This, in turn, affects the routing of cluster traffic.
Figure 6-29 LAN/IP Path (Channel) Adjust Priority
6.5.4.2 LAN Path (Channel) Hops Fix
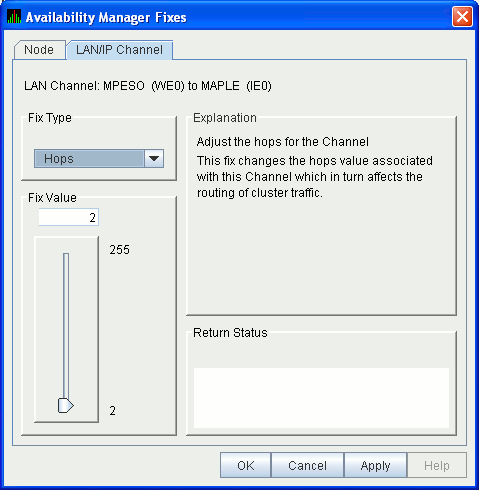
LAN Path (Channel) Hops fix (Figure 6-30) allows you to change the
hops for the channel. This change, in turn, affects the routing of
cluster traffic.
Figure 6-30 LAN/IP Path (Channel) Hops
6.5.5 LAN Device Fixes
To access LAN device fixes, right-click an item in the LAN Path
(Channel) Summary category (see Figure 4-6). The Data Analyzer
displays a shortcut menu with the following options:
Select LAN Device Details to display the LAN Device Details window. From the Device Details window, select Fix... from the Fix menu. (These fixes are also accessible from the LAN Device Summary page.)
The Data Analyzer displays the first of several pages, each of which contains a fix option:
Adjust Priority
Set Max Buffer Size
Start LAN Device
Stop LAN Device
These fixes are described in the following sections.
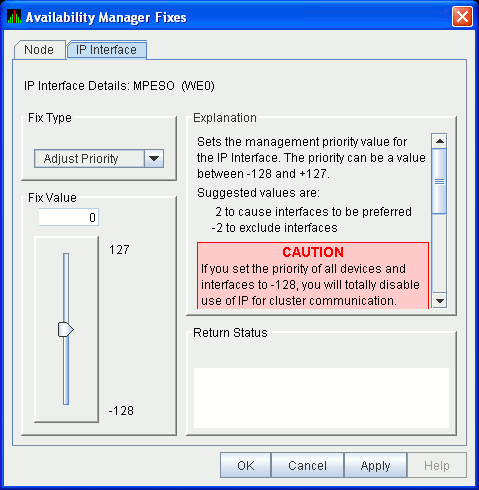
6.5.5.1 LAN Device Adjust Priority Fix
The LAN Device Adjust Priority fix (Figure 6-31) allows you to adjust
the management priority for the device. This fix changes the cost
associated with this device, which, in turn, affects the routing of
cluster traffic.
Starting with OpenVMS Version 7.3-2, a channel whose priority is -128 is not used for cluster communications. The priority of a channel is the sum of the management priority assigned to the local LAN device and the channel itself. Therefore, you can assign any combination of channel and LAN device management priority values to arrive at a total of -128.
Figure 6-31 LAN/IP Device Adjust Priority
6.5.5.2 LAN Device Set Maximum Buffer Fix
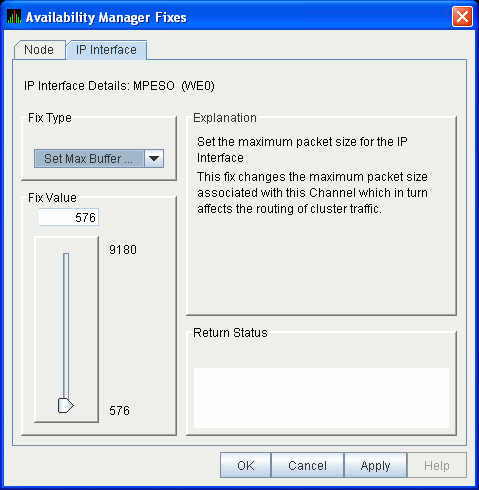
The LAN Device Set Maximum Buffer fix (Figure 6-32) allows you to set
the maximum packet size for the device, which changes the maximum
packet size associated with this channel. This change, in turn, affects
the routing of cluster traffic.
Figure 6-32 LAN Device Set Maximum Buffer Size
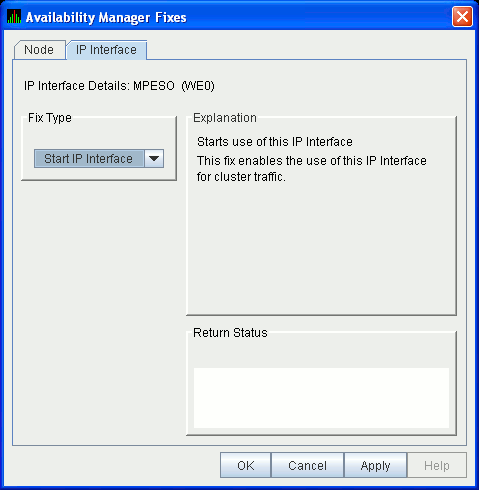
6.5.5.3 LAN Device Start Fix
The LAN Device Start fix (Figure 6-33) starts the use of this
particular LAN device. This fix allows you, at the same time, to enable
this device for cluster traffic.
Figure 6-33 LAN/IP Device Start
6.5.5.4 LAN Device Stop Fix
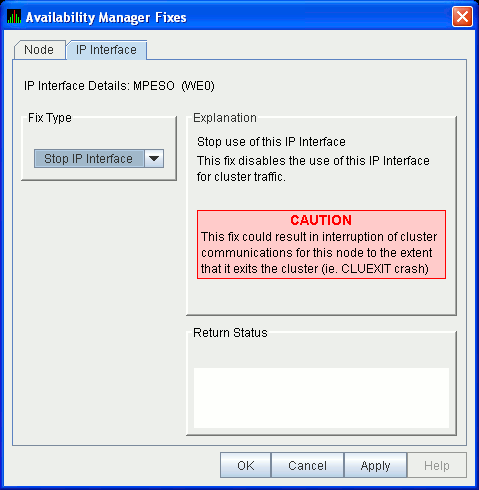
The LAN Device Stop fix (Figure 6-34) stops the use of this
particular LAN device. At the same time, this fix disables this device
for cluster traffic.
This fix could result in interruption of cluster communications for this node. The node might exit the cluster (CLUEXIT crash). |
Figure 6-34 LAN/IP Device Stop
This chapter explains how to customize the following Availability Manager Data Analyzer features:
| Feature | Description |
|---|---|
| Nodes or node groups | You can select one or more groups or individual nodes to monitor. |
| Data collection | For OpenVMS nodes, you can choose the types of data you want to collect as well as set several types of collection intervals. (On Windows nodes, specific types of data are collected by default.) |
| Data filters | For OpenVMS nodes, you can specify a number of parameters and values that limit the amount of data that is collected. |
| Event escalation | You can customize the way events are displayed in the Event pane of the System Overview window (Figure 2-25), and you can configure events to be signaled to OPCOM and OpenView. |
| Event filters | You can specify the severity of events that are displayed as well as several other filter settings for events. |
| Security | On Data Analyzer and Data Collector nodes, you can change passwords. On OpenVMS Data Collector nodes, you can edit a file that contains security triplets. |
| Watch process | You can specify up to eight processes for the Data Analyzer to monitor and report on if they exit and also if they subsequently are created. |
In addition, you can change the group membership of nodes, as explained in Section 7.4.1 and Section 7.4.2.
Table 7-1 shows the levels of customization the Data Analyzer provides. At each level, you can customize specific features. The table shows the features that can be customized at each level.
| Customizable Features | Application | Operating System | Group | Node |
|---|---|---|---|---|
| Nodes or node groups | X | |||
| Data collection | X | X | X | |
| Data filters | X | X | X | |
| Event escalation | X | X | X | X |
| Event filters | X | X | X | |
| Security | X | X | X | |
| Watch process | X | X | X |
You can customize each feature at one or more of the following levels, as shown in Table 7-1:
In addition to the four levels of customization are Availability Manager Data Analyzer Defaults (AM Defaults), which are top-level, built-in values that are preset (hardcoded) within the Availability Manager Data Analyzer. Users cannot change these settings themselves. If no customizations are made at any of the four levels, the AM Default values are used.
The following list describes the four levels of customization.
Any of these four levels of customization overrides AM Defaults. Also,
customizing values at any successive level overrides the value set at
the previous level. For example, customizing values for Data filters at
the Group level overrides values for Data filters set at the Operating
System level. Similarly, customizing values for Data filters at the
Node level overrides values for Data filters set at the Group level.
7.1.1 Recognizing Levels of Customization
The customization levels for various Data Analyzer values are displayed as icons on some pages. The OpenVMS Data Collection Customization page (Figure 7-1) displays several of these icons.
Figure 7-1 OpenVMS Data Collection Customization
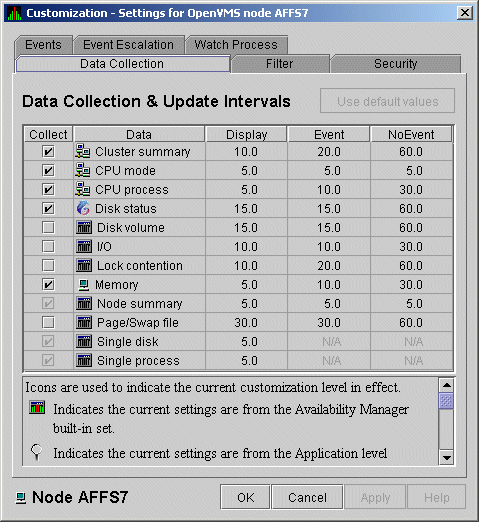
The icons preceding each data item in Figure 7-1 indicate the current customization level for each collection choice. Table 7-2 describes these icons and tells where each appears in Figure 7-1.
| Icon | Location | Meaning |
|---|---|---|
| Graph | Before "Disk volume" | Current setting is from the built-in AM Defaults. |
| Magnifying glass | Bottom left of window | Current setting is from the Application level. |
| Swoosh | Before "Disk status" | Current setting has been modified at the OpenVMS Operating System Level. |
| Double monitors | Before "Cluster summary" | Current setting has been modified at the group level. |
| Single monitor | Before "Memory" | Current setting has been modified at the node level. |
When you customize values, the Data Analyzer keeps track of the next higher level of each value. This means that you can reset a value to the value set at the next higher level.
To return to the values set at the preceding level, click the Use default values button at the top of a customization page. The icon on the "Use default values" button and explanation at the bottom of the page indicate the previous customization level.
In the main System Overview window (see Figure 2-25), you can select
the customization levels that are shown in Table 7-1. The following
sections explain levels of customization in more detail.
7.1.3 Knowing the Number of Nodes Affected by Each Customization Level
Another way of looking at Data Analyzer customization is to consider the number of nodes affected by each level of customization. Depending on which customization menu you use and your choice of menu items, your customizations can affect one or more nodes, as indicated in the following table.
| Nodes Affected | Action |
|---|---|
| All nodes | Select Customize Application... on the menu shown in Figure 7-2. |
| All Windows nodes | Select Operating Systems --> Customize Windows NT... on the menu shown in Figure 7-2. |
| All OpenVMS nodes | Select Operating Systems --> Customize OpenVMS... on the menu shown in Figure 7-2. |
| Nodes in a group | Select Customize... on the shortcut menu shown in Figure 7-7. The customization options you choose affect only the group of nodes that you select. |
| One node | Select Customize... on the shortcut menu shown in Figure 7-8 or on the Customize shortcut menu on the Node page. The customization options you choose affect only the node that you select. |
In the System Overview window menu bar, select Customize. The Data Analyzer displays the shortcut menu shown in Figure 7-2.
Figure 7-2 Application and Operating System Customization Menu
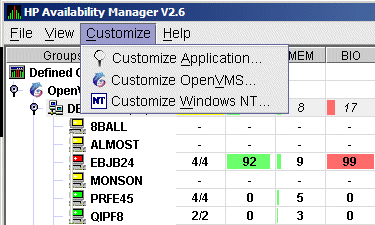
When you select Customize Application..., by default the Data Analyzer displays the Group/Nodes Lists page (Figure 7-3), where the Inclusion lists tab is the default.
The Event Escalation tab displayed on the Application Settings page (Figure 7-3) is explained in Section 7.7. |
On the Groups/Nodes Inclusion page (Figure 7-3) you can select groups of nodes or individual nodes to be displayed.
Figure 7-3 Application Settings---Groups/Nodes Inclusion
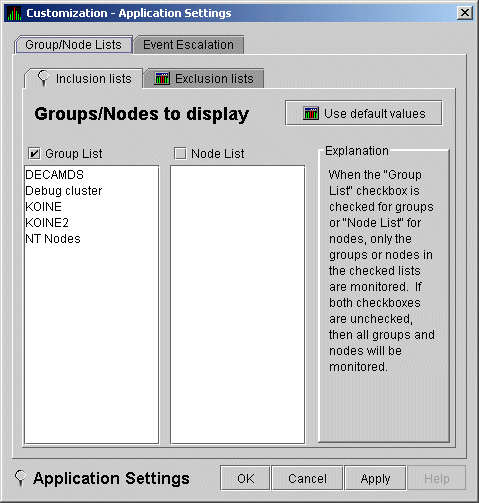
On the Groups/Nodes Inclusion page, you have the following choices:
If you decide to return to the default (Group List: DECAMDS) or to enter names again, select Use default values.
After you enter a list of nodes or groups of nodes, click one of the following buttons at the bottom of the page:
| Option | Description |
|---|---|
| OK | Accepts the choice of names you have entered and exits the page. |
| Cancel | Cancels the choice of names and does not exit the page. |
| Apply | Accepts the choice of names you have entered but does not exit the page. |
If nodes were previously selected for monitoring, their names are not
removed from the display even if you click OK or
Apply. They are filtered out the next time the Data
Analyzer is started.
7.2.1.2 Application Settings---Groups/Nodes Exclusion Lists
As an alternative to the Inclusion lists on the Groups/Nodes Inclusion page, you can click the Exclusion lists tab in Figure 7-4, where you can select groups of nodes or individual nodes to be excluded from display.
Figure 7-4 Application Settings---Groups/Nodes Exclusion Lists
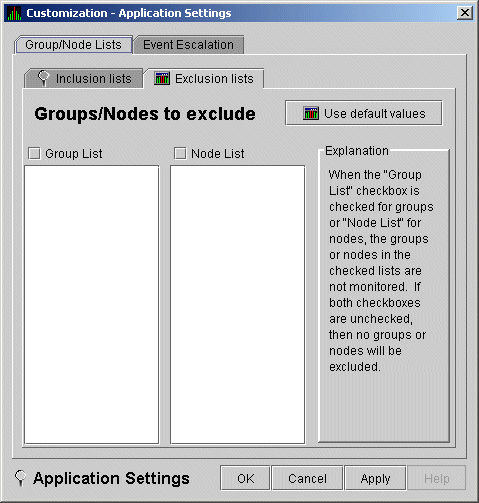
On the Groups/Nodes Exclusion Lists page, you have the following choices:
After you enter a list of nodes or groups of nodes, click one of the buttons at the bottom of the page:
| Option | Description |
|---|---|
| OK | Accepts the choice of names you have entered and exits the page. |
| Cancel | Cancels the choice of names and does not exit the page. |
| Apply | Accepts the choice of names you have entered but does not exit the page. |
If nodes were previously selected for monitoring, their names are not
removed from the display even if you click OK or
Apply to exclude them from monitoring.
7.2.2 Customizing Windows Operating System Settings
When you select Customize Windows NT..., the Data Analyzer displays a page similar to the one shown in Figure 7-5.
Figure 7-5 Windows Operating System Customization
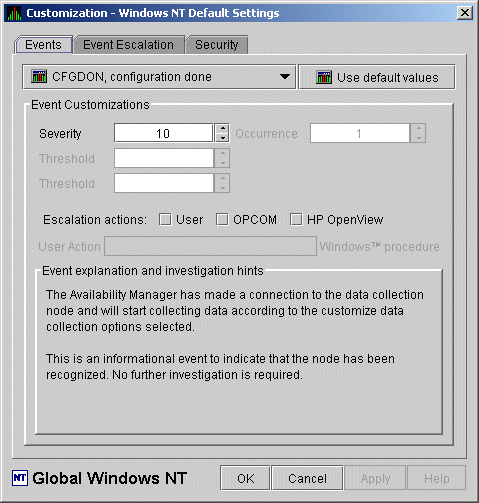
The default page displayed is the Event Customization page.
Instructions for using this page are in Section 7.8.1. The other tabs
displayed are the Event Escalation page, which is explained in
Section 7.7, and the Windows Security Customization page, which is
explained in Section 7.9.2.2.
7.2.3 Customizing OpenVMS Operating System Settings
When you select Customize OpenVMS..., the Data Analyzer displays the pages shown in Figure 7-6, which contains tabs for the last six types of customization listed in Table 7-1. (Instructions for making these types of customizations are later in this chapter, beginning in Section 7.5.
Figure 7-6 OpenVMS Operating System Customization
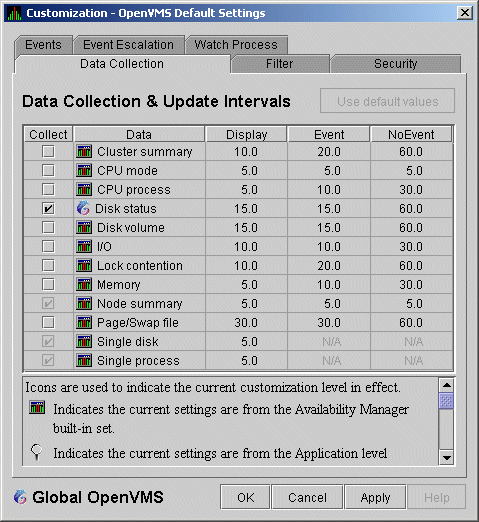
To perform customizations at the group level, right-click a group name in the System Overview window. The Data Analyzer displays a small menu similar to the one shown in Figure 7-7.
Figure 7-7 Group Customization Menu
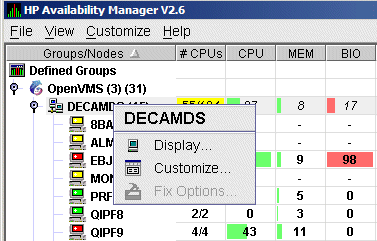
When you select Customize, the Data Analyzer displays
a page similar to the one shown in Figure 7-6.
7.4 Customizing Settings at the Node Level
To customize a specific node, do either of the following:
You can customize nodes in any state. |
Figure 7-8 Node Customization Menu
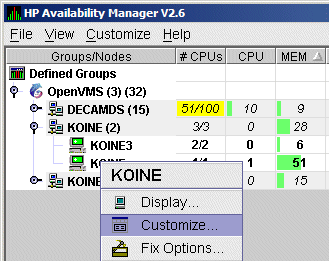
When you select Customize, the Data Analyzer displays
a customization page similar to the one shown in Figure 7-6.
7.4.1 Changing the Group of an OpenVMS Node
Each Availability Manager Data Collector node is assigned to the DECAMDS group by default.
You need to place nodes that are in the same cluster in the same group. If such nodes are placed in different groups, some of the data collected might be misleading. |
You need to edit a logical on each Data Collector node to change the group for that node. To do this, follow these steps:
$ AMDS$DEF AMDS$GROUP_NAME FINANCE ! Group FINANCE; OpenVMS Cluster alias |
$ @SYS$STARTUP:AMDS$STARTUP RESTART |
These instructions apply to versions prior to Version 2.0-1. |
You need to edit the Registry to change the group of a Windows node. To edit the Registry, follow these steps:
Before you start this section, be sure to read the explanation of data collection, events, thresholds, and occurrences in Chapter 1. Also, be sure you understand background and foreground data collection. |
When you choose the Customize OpenVMS menu option in the System Overview window (see Figure 7-2), by default the Data Analyzer displays the OpenVMS Data Collection Customization page (Figure 7-9) where you can select types of data you want to collect for all of the OpenVMS nodes you are currently monitoring. You can also change the default Data Analyzer intervals at which data is collected or updated.
Figure 7-9 OpenVMS Data Collection Customization

Table 7-3 identifies the page on which each type of data collected and displayed in Figure 7-9 appears and indicates whether or not background data collection is turned on for that type of data collection. See Chapter 1 for information about background data collection. (You can also customize data collection at the group and node levels, as explained in Section 7.1.)
When you select a type of data collection, an icon appears on the "Use default values" button indicating the previous (higher) level of customization where customizations might have been made. Pressing the "Use default values" button followed by the "Apply" button causes any customizations made at the current level to be discarded and the values from the previous collection to be used. You can select more than one collection choice using the Shift and/or Ctrl keys. In this case, none of the icons appear on the "Use default values" button. Pressing the "Use default values" button causes each selected collection choice to be reset to the value at its own previous level of customization. |
| Data Collected | Background Data Collection Default | Page Where Data Is Displayed |
|---|---|---|
| Cluster summary | No | Cluster Summary page |
| CPU mode | No | CPU Modes Summary page |
| CPU summary | No | CPU Process States page |
| Disk status | No | Disk Status Summary page |
| Disk volume | No | Disk Volume Summary page |
| I/O data | No | I/O Summary page |
| Lock contention | No | Lock Contention page |
| Memory | No | Memory Summary page |
| Node summary | Yes | Node pane, Node Summary page, and the top pane of the CPU, Memory, and I/O pages |
| Page/Swap file | No | I/O Page Faults page |
| Single disk | Yes 1 | Single Disk Summary page |
| Single process | Yes 2 | Data collection for the Process Information page |
You can choose additional types of background data collection by selecting the Collect check box for each one on the Data Collection Customization page of the Customize OpenVMS... menu (Figure 7-6). A check mark indicates that data is to be collected at the intervals described in Table 7-4.
For accurate evaluation of events that require cluster-wide data collection (lock contention, disk status and volume), it is recommended that cluster-wide data collections be collected with background data collection at the OpenVMS Group level. This is described in Section 7.3. |
| Interval Name | Description |
|---|---|
| Display | How often the data is collected when its corresponding display is active. |
| Event | How often the data is collected when its corresponding display is not active and when events are active. |
| NoEvent | How often the data is collected when its corresponding display is not active and when events are not active. |
You can enter a different collection interval by selecting a row of data and selecting a value. Then delete the old value and enter a new one.
If you change your mind and decide to return to the default collection interval, select one or more rows of data items: then select Use default values. The system displays the default values for all the collection intervals.
When you finish customizing your data collection, click one of the following buttons at the bottom of the page:
| Option | Description |
|---|---|
| OK | To confirm any changes you have made and exit the page. |
| Cancel | To cancel any changes you have made and exit the page. |
| Apply | To confirm and apply any changes you have made and not exit the page. |
When you choose "Customize" at the operating system, group, or node level and then select the Filter tab, the Data Analyzer displays pages that allow you to customize data (see Figure 7-10). The types of data filters available are the following:
Filters can vary depending on the type of data collected. For example, filters might be process states or a variety of rates and counts. The following sections describe data filters that are available for various types of data collection.
You can also customize filters at the group and node levels (see Section 7.1).
Keep in mind that the customizations that you make at the various levels override the ones set at the previous level (see Table 7-1). The icons preceding each data item (see Table 7-2) indicate the level at which the data item was customized. In Figure 7-10, for example, the icon preceding "CPU" indicates that the current setting comes from the AM Defaults.
If you change your mind and decide to return to filter values set at the previous level, select Use default values. The icon appearing on the button indicates the level of the previous values. In Figure 7-10, for example, the previous value is the AM Defaults value.
When you finish modifying filters on a page, click one of the following buttons at the bottom of the page:
| Option | Description |
|---|---|
| OK | To confirm any changes you have made and exit the page. |
| Cancel | To cancel any changes you have made and exit the page. |
| Apply | To confirm and apply any changes you have made and continue to display the page. |
When you select "CPU" on the Filter tabs, the Data Analyzer displays the OpenVMS CPU Filters page (Figure 7-10).
Figure 7-10 OpenVMS CPU Filters
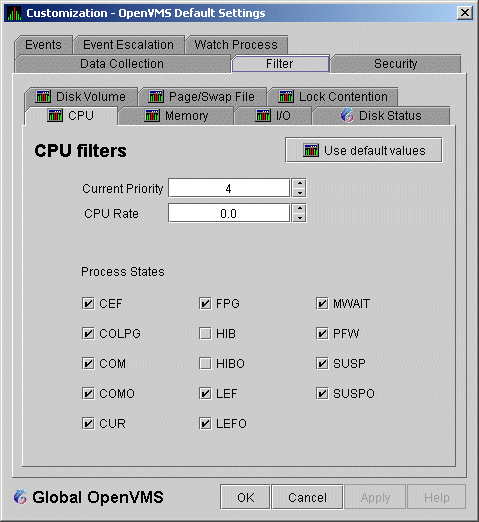
The OpenVMS CPU Filters page allows you to change and select values that are displayed on the OpenVMS CPU Process States page (Figure 3-8).
You can change the current priority and rate of a process. By default, a process is displayed only if it has a Current Priority of 4 or more. Click the up or down arrow to increase or decrease the priority value by one. The default CPU rate is 0.0, which means that processes with any CPU rate used will be displayed. To limit the number of processes displayed, you can click the up or down arrow to increase or decrease the CPU rate by .5 each time you click.
The OpenVMS CPU Filters page also allows you to select the states of
the processes that you want to display on the CPU Process States page.
Select the check box for each state you want to display. (Process
states are described in Appendix A.)
7.6.2 OpenVMS Disk Status Filters
When you select Disk Status on the Filter tabs, the Data Analyzer displays the OpenVMS Disk Status Filters page (Figure 7-11).
Figure 7-11 OpenVMS Disk Status Filters
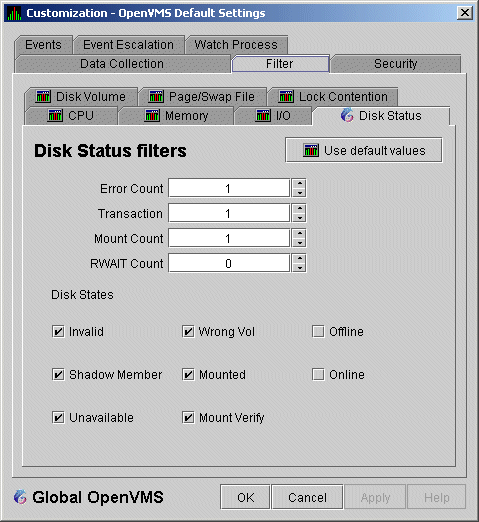
The OpenVMS Disk Status Summary page (Figure 3-14) displays the values you set on this page.
This page lets you change the following default values:
| Data | Description |
|---|---|
| Error Count | The number of errors generated by the disk (a quick indicator of device problems). |
| Transaction | The number of in-progress file system operations for the disk. |
| Mount Count | The number of nodes that have the specified disk mounted. |
| RWAIT Count | An indicator that a system I/O operation is stalled, usually during normal connection failure recovery or volume processing of host-based shadowing. |
This page also lets you check the states of the disks you want to display, as described in the following table:
| Disk State | Description |
|---|---|
| Invalid | Disk is in an invalid state (Mount Verify Timeout is likely). |
| Shadow Member | Disk is a member of a shadow set. |
| Unavailable | Disk is set to unavailable. |
| Wrong Vol | Disk was mounted with the wrong volume name. |
| Mounted | Disk is logically mounted by a MOUNT command or a service call. |
| Mount Verify | Disk is waiting for a mount verification. |
| Offline | Disk is no longer physically mounted in device drive. |
| Online | Disk is physically mounted in device drive. |
When you select Disk Volume on the Filter tabs, the Data Analyzer displays the OpenVMS Disk Volume Filters page (Figure 7-12).
Figure 7-12 OpenVMS Disk Volume Filters
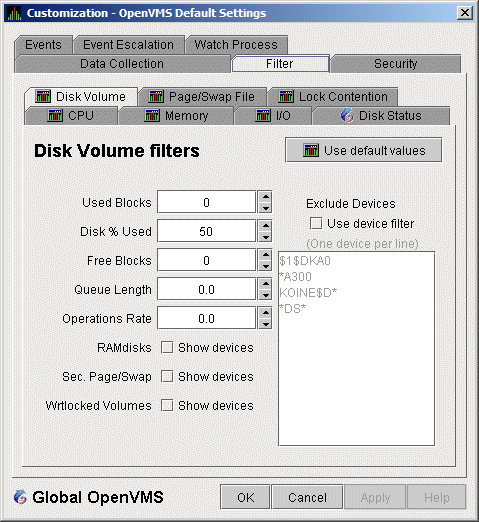
The OpenVMS Disk Volume Filters page allows you to change the values for the following data:
| Data | Description |
|---|---|
| Used Blocks | The number of volume blocks in use. |
| Disk % Used | The percentage of the number of volume blocks in use in relation to the total volume blocks available. |
| Free Blocks | The number of blocks of volume space available for new data. |
| Queue Length | Current length of I/O queue for a volume. |
| Operations Rate | The rate at which the operations count to the volume has changed since the last sampling. The rate measures the amount of activity on a volume. The optimal load is device specific. |
You can also change options for the following to be on (checked) or off (unchecked):
When you select I/O on the Filter tabs, the Data Analyzer displays the OpenVMS I/O Filters page (Figure 7-13).
Figure 7-13 OpenVMS I/O Filters
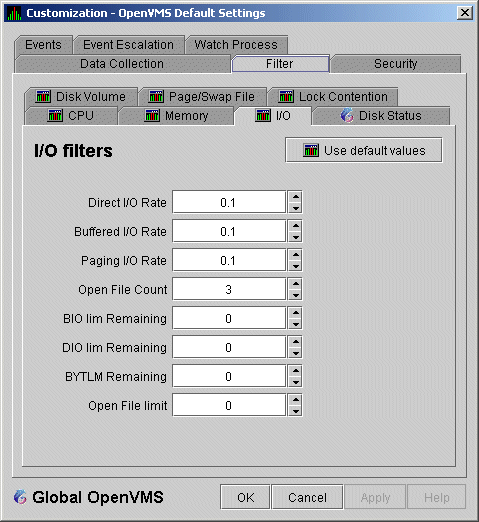
The OpenVMS I/O Summary page (Figure 3-12) displays the values you set on this filters page.
This filters page allows you to change values for the following data:
| Data | Description |
|---|---|
| Direct I/O Rate | The rate of direct I/O transfers. Direct I/O is the average percentage of time that the process waits for data to be read from or written to a disk or tape. The possible state is DIO. Direct I/O is usually disk or tape I/O. |
| Buffered I/O Rate | The rate of buffered I/O transfers. Buffered I/O is the average percentage of time that the process waits for data to be read from or written to a slower device such as a terminal, line printer, mailbox. The possible state is BIO. Buffered I/O is usually terminal, printer I/O, or network traffic. |
| Paging I/O Rate | The rate of read attempts necessary to satisfy page faults (also known as Page Read I/O or the Hard Fault Rate). |
| Open File Count | The number of open files. |
| BIO lim Remaining | The number of remaining buffered I/O operations available before the process reaches its quota. BIOLM quota is the maximum number of buffered I/O operations a process can have outstanding at one time. |
| DIO lim Remaining | The number of remaining direct I/O limit operations available before the process reaches its quota. DIOLM quota is the maximum number of direct I/O operations a process can have outstanding at one time. |
| BYTLM Remaining | The number of buffered I/O bytes available before the process reaches its quota. BYTLM is the maximum number of bytes of nonpaged system dynamic memory that a process can claim at one time. |
| Open File limit | The number of additional files the process can open before reaching its quota. FILLM quota is the maximum number of files that can be opened simultaneously by the process, including active network logical links. |
The OpenVMS Lock Contention Filters page allows you to remove (filter out) resource names from the Lock Contention page (Figure 3-19).
When you select Lock Contention on the Filter tabs, the Data Analyzer displays the OpenVMS Lock Contention Filters page (Figure 7-14).
Figure 7-14 OpenVMS Lock Contention Filters
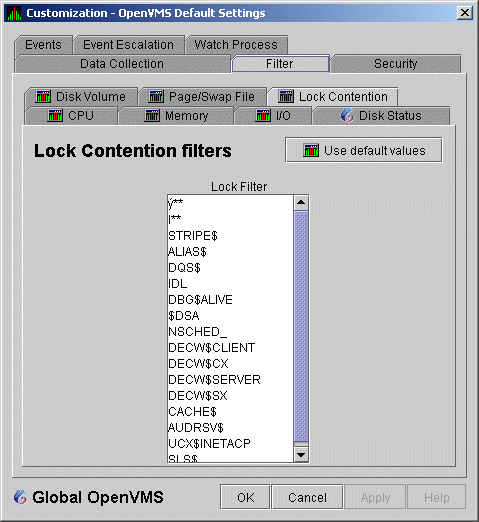
Each entry on the Lock Contention Filters page is a resource name or part of a resource name that you want to filter out. For example, the STRIPE$ entry filters out any value that starts with the characters STRIPE$. In the example of |** in Figure 7-14, the two asterisks are literal asterisks, not wildcard characters.
For resources that contain byte values that are not printable, the Hex Edit pane at the bottom of the Lock Contention Filters page allows you to enter these byte values in hexadecimal.
To redisplay values set previously, select Use default
values.
7.6.6 OpenVMS Memory Filters
When you select Memory Filters on the Filter tabs, the Data Analyzer displays an OpenVMS Memory Filters page that is similar to the one shown in (Figure 7-15).
Figure 7-15 OpenVMS Memory Filters
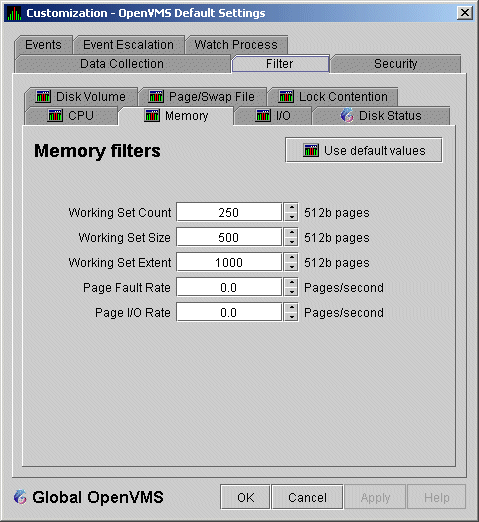
The OpenVMS Memory page (Figure 3-10) displays the values on this filter page.
The OpenVMS Memory Filters page allows you to change values for the following data:
| Data | Description |
|---|---|
| Working Set Count | The number of physical pages or pagelets of memory that the process is using. |
| Working Set Size | The number of pages or pagelets of memory the process is allowed to use. The operating system periodically adjusts this value based on an analysis of page faults relative to CPU time used. An increase in this value in large units indicates a process is receiving a lot of page faults and its memory allocation is increasing. |
| Working Set Extent | The number of pages or pagelets of memory in the process's WSEXTENT quota as defined in the user authorization file (UAF). The number of pages or pagelets will not exceed the value of the system parameter WSMAX. |
| Page Fault Rate | The number of page faults per second for the process. |
| Page I/O Rate | The rate of read attempts necessary to satisfy page faults (also known as page read I/O or the hard fault rate). |
When you select Page/Swap File on the Filter tabs, the Data Analyzer displays the OpenVMS Page/Swap File Filters page (Figure 7-16).
Figure 7-16 OpenVMS Page/Swap File Filters
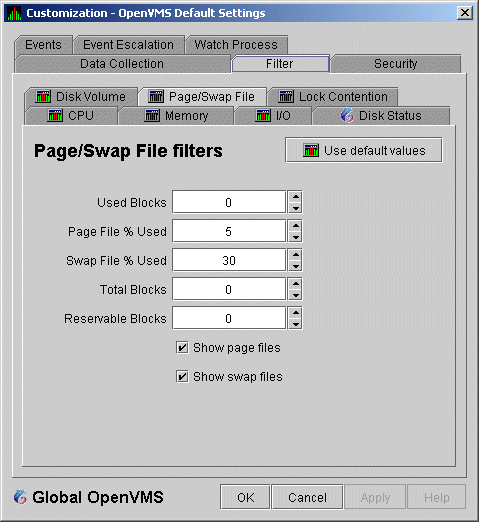
The OpenVMS I/O Summary page (Figure 3-12) displays the values that you set on this filter page.
This filter page allows you to change values for the following data:
| Data | Description |
|---|---|
| Used Blocks | The number of used blocks within the file. |
| Page File % Used | The percentage of the blocks from the page file that have been used. |
| Swap File % Used | The percentage of the blocks from the swap file that have been used. |
| Total Blocks | The total number of blocks in paging and swapping files. |
| Reservable Blocks |
Number of reservable blocks in each paging and swapping file currently
installed. Reservable blocks can be logically claimed by a process for
a future physical allocation. A negative value indicates that the file
might be overcommitted. Note that a negative value is not an immediate
concern but indicates that the file might become overcommitted if
physical memory becomes scarce.
Note: Reservable blocks are not used in more recent versions of OpenVMS. |
You can also select (turn on) or clear (turn off) the following options:
You can customize the way events are displayed in the Event pane of the System Overview window (Figure 2-25) and configure events to be signaled to OPCOM or HP OpenView. You do this by setting the criteria that determine whether events are signaled on the Event Escalation Customization page (Figure 7-17).
Event escalation is the one set of Data Analyzer parameters that you can adjust at all four configuration levels (Application, Operating System, Group, and Node). |
When you select any of the customization options, the Data Analyzer displays a tabbed page similar to the one shown in Figure 7-17.
Figure 7-17 Event Escalation Customization
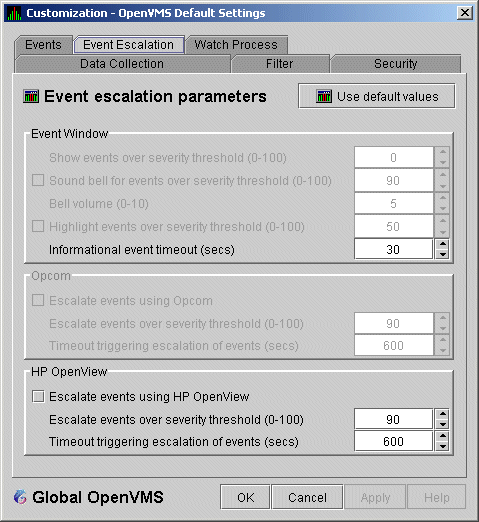
The Event Escalation Customization page contains the following sections:
| Availability Manager | OpenView |
|---|---|
| 0 - 19 | Normal |
| 20 - 39 | Warning |
| 40 - 59 | Minor |
| 60 - 79 | Major |
| 80 - 100 | Critical |
For an event to be escalated using OPCOM or HP OpenView, the following conditions must be met:
|
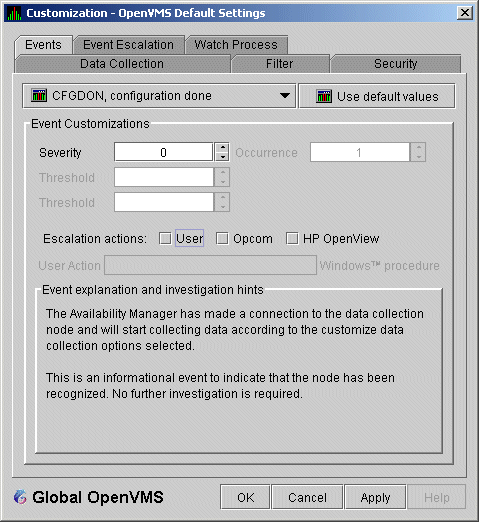
Figure 7-18 Event Customizations
The instructions in this section are for configuring HP OpenView on Windows. (The configuration for HP-UX systems is very similar; instructions, however, are not included in this section.) |
Installing the HP OpenView Server
Prior to configuring HP OpenView, you must perform two steps:
http://h71000.www7.hp.com/openvms/products/availman/docs.html |
Configuring the HP OpenView Server and Agents
You can run the Data Analyzer on a Windows or on an OpenVMS system.
If you run the Data Analyzer on a Windows system, follow these steps:
HP OpenView\Operations Manager |
If you run the Data Analyzer on an OpenVMS system, follow these steps:
http://h71000.www7.hp.com/openvms/products/openvms_ovo_agent/index.html |
On the OpenView server you can create or modify policies or templates of the Open Message Interface group to manipulate events that the Data Analyzer has escalated. For parameters or options fields the Data Analyzer sets, see Table 7-5.
| Parameter or Option Field | Description |
|---|---|
| <$MSG_APPL> | Application: "AvailMan" (appears to be case sensitive) |
| <$MSG_OBJECT> | Object: 6-character event name (example: "HIBIOR") |
| <$MSG_GRP> | Group: Node originating the event (example: "CMOVEQ") |
| <$MSG_SEV> | Derived from <$OPTION(SEVERITY)> in the Data Analyzer; the Data Analyzer maps SEVERITY to NORMAL, WARNING, MINOR, MAJOR, CRITICAL |
| <$MSG_TEXT> | Message text: Event description (example: "CMOVEQ buffered I/O rate is high") |
| <$MSG_NODE> | Node running AvailMan |
| <$MSG_NODE_NAME> | Node running AvailMan |
| <$OPTION(NODE)> | Node originating the event (example: "CMOVEQ") |
| <$OPTION(GROUP)> | Group to which originating node belongs (example: "Debug cluster") |
| <$OPTION(SEQUENCE_NUMBER)> | AM internal event sequence number (example: "14") |
| <$OPTION(SEVERITY)> | AM event severity (0-100) (example: "60") |
| <$OPTION(EVENT)> | 6-character event name (example: "HIBIOR") |
| <$OPTION(TIME)> | Original time event posted (example: "15-Aug-2005 14:41:44.164") |
You can customize a number of characteristics of the events that are displayed in the Event pane of the System Overview window (Figure 2-25). You can also use customization options to notify users when specific events occur.
When you select the Operating System --> Customize OpenVMS... or Operating System --> Customize Windows NT... from the System Overview window Customize menu, the Data Analyzer displays a tabbed page similar to the one shown in Figure 7-19.
Figure 7-19 Event Customizations

On OpenVMS systems, you can customize events at the operating system, group, or node level. On Windows systems, you you can customize events at the operating system or node level.
Keep in mind that an event that you customize at the group level
overrides the value set at a previous (higher) level (see
Table 7-1).
7.8.1 Customizing Events
You can change the values for any data that is available---that is, not dimmed---on this page. The following table describes the data you can change:
| Data | Description |
|---|---|
| Severity | Controls the severity level at which events are displayed in the Event pane of the System Overview window (Figure 2-25). By default, all events are displayed. Increasing this value reduces the number of event messages in the Event pane of the System Overview window (Figure 2-25) and can improve perceived response time. |
| Occurrence |
Each Availability Manager event is assigned an
occurrence value,
that is, the number of consecutive data samples that must exceed the
event threshold before the event is signaled.
By default, events have low occurrence values. However, you might find
that a certain event indicates a problem only when it occurs repeatedly
over an extended period of time. You can change the occurrence value
assigned to that event so that the Data Analyzer signals the event only
when necessary.
For example, suppose page fault spikes are common in your environment, and the Data Analyzer frequently signals intermittent HITTLP, total page fault rate is high events. You could change the event's occurrence value to 3, so that the total page fault rate must exceed the threshold for three consecutive collection intervals before being signaled to the event log. To avoid displaying insignificant events, you can customize an event so that the Data Analyzer signals it only when it occurs continuously. |
| Threshold |
Most events are checked against only one threshold; however, some
events have dual
thresholds: the event is triggered if either one is true. For example,
for the
LOVLSP, node disk volume free space is low event, the Data
Analyzer checks both of the following thresholds:
|
| Escalation actions |
You can enter one or more of the following values:
|
| User Action | When the Event escalation action field is set to User, User Action is no longer dimmed. You can enter the name of a procedure to be executed if the event displayed at the top of the page occurs. To use this field, see the instructions in Section 7.8.2. |
The "Event explanation and investigation hints" section of
the Event Customizations page, which is not customizable, includes a
description of the event displayed and suggestions for how to correct
any problems that the event signals.
7.8.2 Entering a User Action
OpenVMS and Windows execute the User Action procedure somewhat differently, as explained in the following paragraphs. |
The following notes pertain to writing and executing User Action commands or command procedures. These notes apply to User Actions on both OpenVMS and Windows systems.
AMGR/KOINE -- 13-Apr-2005 15:33:02.531 --<0,CFGDON>KOINE configuration done AMGR/KOINE -- 13-Apr-2005 15:33:02.531 --<0,CFGDON>KOINE configuration done (User Action issued for this event on the client O/S) |
Enter the name of the procedure you want OpenVMS to execute (see Figure 7-19) after "User Action." Use the following format:
disk:[directory]filename.COM
where:
The User Action procedure must contain one or more DCL command statements that form a valid OpenVMS command procedure.
The User Action procedure is passed as a string value to the DCL command interpreter as follows:
SUBMIT/NOPRINTER/LOG user_action_procedure arg_1 arg_2 arg_3 arg_4
where:
| Argument | Description |
|---|---|
| arg_1 | Node name of the node that generated the event. |
| arg_2 | Date and time that the event was generated. |
| arg_3 | Name of the event. |
| arg_4 | Description of the event. |
The Data Analyzer does not interpret the string contents. You can supply any content in the User Action procedure that DCL accepts in the OpenVMS environment for the user account running the Data Analyzer. However, if you include arguments in the User Action procedure, they might displace or overwrite arguments that the Data Analyzer supplies.
A suitable batch queue must be available on the Data Analyzer computer to be the target of the SUBMIT command. See the HP OpenVMS DCL Dictionary for the SUBMIT, INITIALIZE/QUEUE, and START/QUEUE commands for use of batch queues and the queue manager.
An example of a DCL command procedure is:
DISK$PAYROLL:[AM_COMS]DISK_OFFLINE.COM |
The contents of the DCL command procedure might be the following:
$ if (p3.eqs."DSKOFF").and.(p1.eqs."PAYROL") $ then $ mail/subject="''p2' ''p3' ''p4'" urgent_instructions.txt call_center,finance,adams $ else $ mail/subject="''p2' ''p3' ''p4'" instructions.txt call_center $ endif |
The pn numbers in the DCL procedure correspond in type, number, and position to the arguments in the preceding table.
You might use a procedure like this one to notify several groups if the
payroll disk goes off line, or to notify the call center if any other
event occurs.
7.8.2.2 Executing a Procedure on a Windows System
Enter the name of the procedure you want Windows to execute using the following format:
device:\directory\filename.BAT
where:
The file name must follow Windows file-naming conventions. However, due to the processing of spaces in the Java JRE, HP recommends that you not use spaces in a path or file name. HP recommends that you use a batch file to process and call procedures and applications. |
The Data Analyzer passes the User Action procedure to the Windows command interpreter as a string value as follows:
"AT time CMD/C user_action_procedure arg_1 arg_2 arg_3 arg_4"
where:
| Argument | Description |
|---|---|
| arg_1 | Node name of the node that generated the event. |
| arg_2 | Date and time that the event was generated. |
| arg_3 | Name of the event. |
| arg_4 | Description of the event. |
The Data Analyzer does not interpret the string contents. You can supply any content in the string that the Windows command-line interpreter accepts for the user account running the Data Analyzer. However, if you include arguments in the User Action procedure, they might displace or overwrite arguments that the Data Analyzer supplies.
You cannot specify positional command-line switches or arguments to the AT command, although you can include switches in the User Action procedure substring as qualifiers to the user-supplied command. This is a limitation of both the Windows command-line interpreter and the way the entire string is passed from the Data Analyzer to Windows.
The Schedule service must be running on the Data Analyzer computer in order to use the AT command. However, the Schedule service does not run by default. To start the Schedule service, see the Windows documentation for instructions in the use of the CONTROL PANEL->SERVICES->SCHEDULE->[startup button].
To set up a user action, follow these steps:
c:\send_message.bat |
Figure 7-20 User Action Example
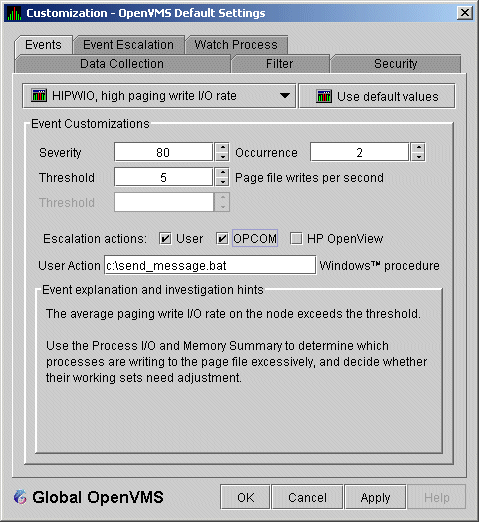
The command line parameters are automatically added when the Data Analyzer passes the command to the command processor.
The contents of "send_message.bat" are the following:
net send affc17 "P4:system event: %1 %2 %3 %4"
|
On the target node, AFFC17, a message similar to the following one is displayed:

You can now apply the User Action to one node, all nodes, or a group of
nodes, as explained in Section 7.8.2.
7.9 Customizing Security Features
The following sections explain how to change the following security features:
OpenVMS Data Collector nodes can have more than one password: each password is part of a security triplet. (Windows nodes allow you to have only one password per node.) |
For both the Windows and OpenVMS Customization Pages at the operating system, group, or node level is a page similar to the one shown in Figure 7-6. It contains a tab labeled Security. If you select this tab on either system, the Data Analyzer displays a page similar to the one shown in Figure 7-21.
Figure 7-21 OpenVMS Security Customization
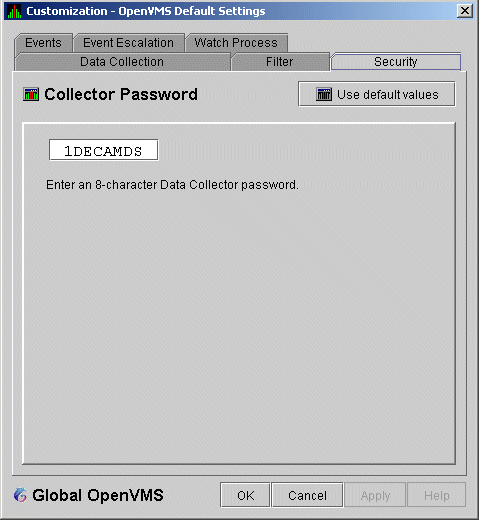
The level at which you can make password changes depends on whether you select the Security tab at the operating system, group, or node level.
Changing Passwords at the Group Level
If you monitor several groups, but the password for the nodes in one of those groups is different from the password for nodes in other groups, right-click the group you want to change, select Customize from the list, select the Security tab, and change the password. The new password is then used for each node that is a member of that group.
Changing Passwords at the Node Level
As a second example, to change the password of one node in a group to a different password than the other nodes in the group, right-click that node, select Customize from the list, select the Security tab, and change the password to one that differs from the other nodes in the group. For that node, the new password overrides the group password.
In the second password example, if you want to set the password for the single node back to the password that the rest of the group uses, click Use default values. The password value for the node now comes from the group-level password setting. At this point, if you change the group password, all nodes in the group get the new password. Additional information about changing passwords for security is in Section 7.9.
| Previous | Next | Contents | Index |