Software > OpenVMS Systems > Documentation > 83final > 6552 HP OpenVMS Systems Documentation |
HP OpenVMS Availability Manager User's Guide
Chapter 4
|
||||||||||||||||||||||||||||||||||||||||||||||||||||||||||||||||||||||||||||||||||||||||||||||||||||||||||||||||||||||||||||||||||||||||||||||||||||||||||||||||||||||||||||||||||||||||||||||||||||||||||||||||||||||||||||||||||||||||||||||||||||||||||||||||||||||||||
To enable managed object data collection on nodes running OpenVMS Version 7.3 and later, the system manager must take steps so that the Data Collector driver, RMDRIVER, is loaded early in the boot process. For more details on how to enable collection of managed object data, see the Installation Instructions. |
LAN Displays
When you monitor OpenVMS Version 7.3 and later nodes with managed objects enabled, additional cluster data and fixes are available for LAN virtual circuits. This data includes enhanced LAN virtual circuit summary data in the Cluster Summary window and the LAN Virtual Circuit Details (NISCA) window. In addition, the Cluster Summary includes virtual circuit, channel, and device fixes. If managed object support is not enabled for a Data Collector node, then only basic virtual circuit data is available.
To display the OpenVMS Cluster Summary page (Figure 4-1), click the Cluster Summary tab on an OpenVMS Node Summary page (Figure 1-5).
The Cluster Summary page contains cluster interconnect information for an entire cluster as well as detailed information about each node in the cluster, including System Communications Services (SCS) circuits and connections for individual nodes.
The data items shown on this page correspond to data that the Show Cluster utility (SHOW CLUSTER) displays for the SYSTEMS, MEMBERS, CONNECTIONS, and CIRCUITS classes. No SHOW CLUSTER counterpart exists for the PEDRIVER LAN virtual circuit, channel, and device detail displays. The data items shown on the page also correspond to data that the SCACP utility displays for SHOW commands that display PORT, CIRCUIT, VC, CHANNEL, and LAN DEVICE information.
Figure 4-1 OpenVMS Cluster Summary
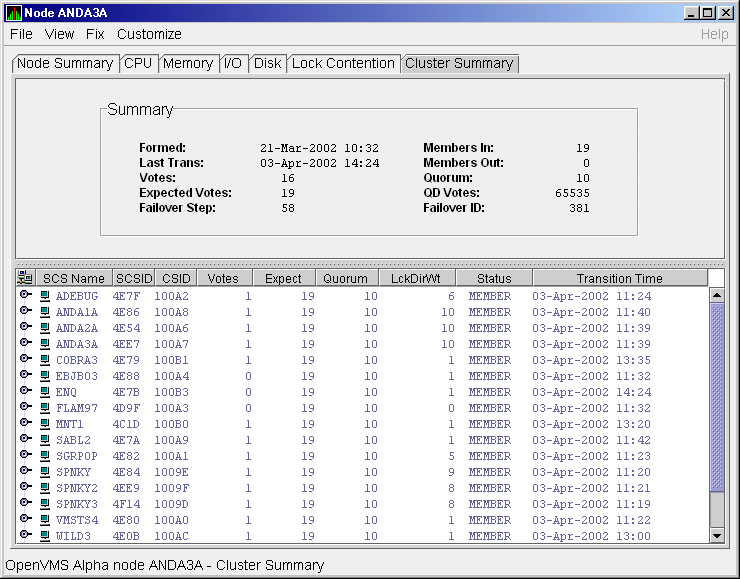
The two panes in the Cluster Summary page display the following information:
The Availability Manager signals the LOVOTE event when cluster votes minus cluster quorum is less than the threshold value for the event. (The default threshold for the LOVOTE event is 1.)
LOVOTE, 'node' VOTES count is close to or below QUORUM |
Table 4-1 describes the data in the OpenVMS Cluster Summary pane (Figure 4-1).
| Data | Description |
|---|---|
| Formed | Date and time the cluster was formed. |
| Last Trans | Date and time of the most recent cluster state transition. |
| Votes | Total number of quorum votes being contributed by all cluster members and by the quorum disk. |
| Expected Votes | The expected votes contribution by all members of the cluster. This value is calculated from the maximum EXPECTED_VOTES system parameter and the maximized value of the VOTES system parameter. |
| Failover Step | Current failover step index. Shows which step in the sequence of failover steps the failover is currently executing. |
| Members In | Number of cluster members to which the Availability Manager has a connection. |
| Members Out | Number of cluster members to which the Availability Manager either has no connection or has lost its connection. |
| Quorum 1 | Number of votes that must be present for the cluster to function and to permit user activity, that is, to "maintain cluster quorum." |
| QD Votes | Number of votes given to the quorum disk. A value of 65535 means no quorum disk exists. |
| Failover ID | Failover instance identification. Unique ID of a failover sequence that indicates to system managers whether a failover has occurred since the last time they checked. |
The Cluster Members pane (the lower pane on the Cluster Summary page (Figure 4-1) lists all the nodes in the cluster and provides detailed information about each one. Figure 4-2 shows only the Cluster Members pane.
Figure 4-2 OpenVMS Cluster Members Pane
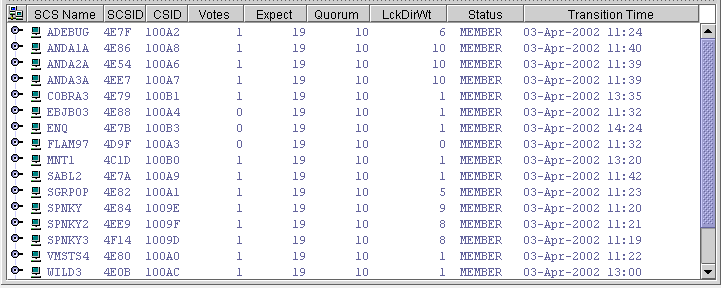
The first level of information in the Cluster Members pane is cluster member data, which is described in Table 4-2.
| Data | Description | ||||||||||||||||||
|---|---|---|---|---|---|---|---|---|---|---|---|---|---|---|---|---|---|---|---|
| SCS Name | System Communications Services (SCS) name for the node (system parameter SCSNODE). | ||||||||||||||||||
| SCSID | SCS identification for the node (system parameter SCSYSTEMID). | ||||||||||||||||||
| CSID | Cluster system identification. | ||||||||||||||||||
| Votes | Number of votes the member contributes. | ||||||||||||||||||
| Expect | Member's expected votes as set by the EXPECTED_VOTES system parameter. | ||||||||||||||||||
| Quorum | Number of votes that must be present for the cluster to function and permit user activity, that is, to "maintain cluster quorum." | ||||||||||||||||||
| LckDirWt | Lock manager distributed directory weight as determined by the LCKDIRWT system parameter. | ||||||||||||||||||
| Status |
Current cluster member status:
|
||||||||||||||||||
| Transition Time | The time of the system's last change in cluster membership status. |
The following sections contain descriptions of the categories of summary data displayed in the Cluster Members pane (Figure 4-2).
When you click the handle before an SCS (System Communications Services) Name, the Availability Manager first displays a Ports heading, if managed object data collection is enabled on this SCS node.
A port is an OpenVMS device that provide SCA (System Communications Architecture) services. Port summary data is discussed in Section 4.2.1. Below the Ports heading is the Circuits heading, which precedes a line of SCA headings. (SCA data is discussed in Section 4.2.2.)
When you initially click the handle in front of Ports in the Cluster Members pane (Figure 4-1) to a vertical position, Ports headings are displayed, with information about port interfaces on the local system, as shown in Figure 4-3.
Figure 4-3 Port Summary Data
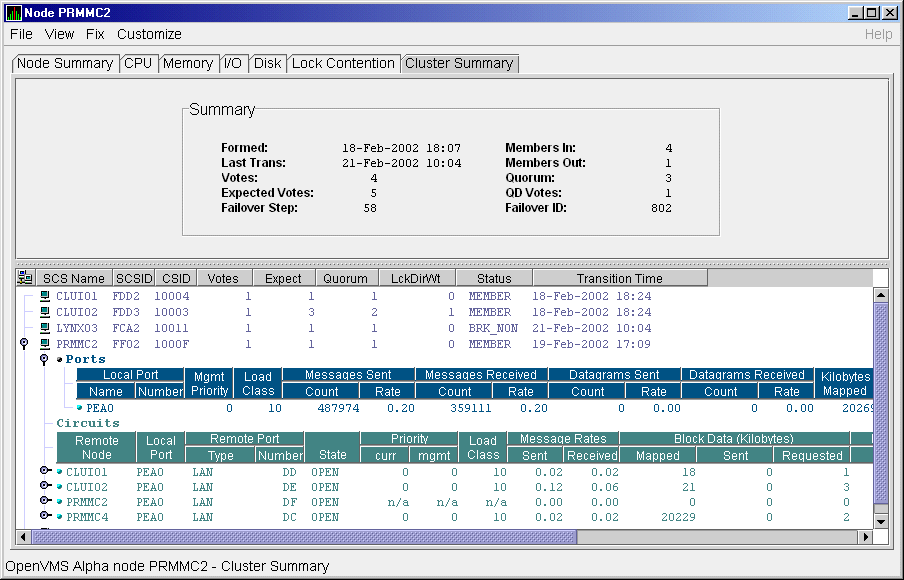
The port summary data shown in Figure 4-3 is described in Table 4-3. Data items in this table are related to the SCACP utility SHOW PORTS display and the SHOW CLUSTER utility LOCAL_PORT CLASS display.
| Data | Description | |
|---|---|---|
| Local Port: | ||
| Name | Device name of the port. | |
| Number | The local port's interconnect address or other interconnect-specific identifier. | |
| Mgmt Priority | Management priority assigned to the port. | |
| Load Class | Hard-coded capacity value of the port, based on the rate (in megabits/second) of the interconnect of the port. | |
| Messages Sent: | ||
| Count | Total number of messages sent since the port was initialized. | |
| Rate | Rate at which messages are sent (per second). | |
| Messages Received: | ||
| Count | Total number of messages sent since the port was initialized. | |
| Rate | Rate at which SCS messages are received (per second). | |
| Datagrams Sent: | ||
| Count | Total number of SCS datagrams sent since the port was initialized. | |
| Rate | Rate at which SCS datagrams are sent (per second). | |
| Datagrams Received: | ||
| Count | Total number of SCS datagrams sent since the port was initialized. | |
| Rate | Rate at which SCS datagrams are sent (per second). | |
| Kilobytes Mapped | Number of kilobytes mapped for block transfer. | |
Below the Circuits heading in Figure 4-4 is a line of SCA summary headings that include information about a node's SCS circuits between local SCA ports and remote SCA ports on other nodes in the cluster. More than one circuit indicates more than one communications path to the other node.
The data displayed in Figure 4-4 is similar to the information that the Show Cluster utility (SHOW CLUSTER) displays for the CIRCUITS, CONNECTIONS, and COUNTERS classes and that the SCACP utility's SHOW CIRCUITS command displays. Note that circuit count is the total number of events since the the state of the circuit changed to OPEN.
Starting with Availability Manager Version 2.2, the circuits display shows circuits to non-OpenVMS nodes, such as storage controllers.
Figure 4-4 SCA Summary Data
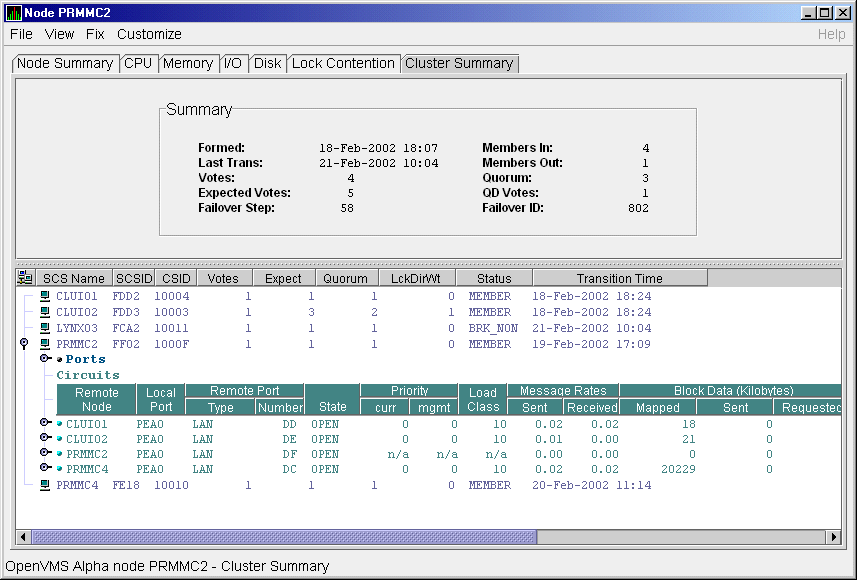
Table 4-4 describes the SCA summary data displayed under the Circuits heading in Figure 4-4. Each line of data shows either a summary of an SCS connection between a local system connection of an application (or SYSAP) to a remote SYSAP that uses the circuit, or a summary of interconnect-specific information about the operation of the circuit.
Some of the data described in Table 4-4 is not displayed in Figure 4-4 because the screen display is wider than shown. You can scroll to the right on your terminal screen to display the remaining fields described in the table.
Each rate referred to in Figure 4-4 is in messages per second. The "Message Rates" data are rates; the remaining data items are counts. |
| Data | Description | |
|---|---|---|
| Remote Node | SCS name of the remote node containing the remote port of the circuit. | |
| Local Port | The device name of the local port associated with the circuit. | |
| Remote Port: | ||
| Type | The remote port's device or interconnect type associated with the circuit (for example, LAN, CIPCA, DSSI). | |
| Number | The remote port's interconnect address, or another other interconnect-specific unique identifier. | |
| State | The state of the virtual circuit connection. | |
| Priority: | ||
| Curr | Circuit's current priority, which is the sum of the management priorities assigned to the circuit and associated local port. | |
| Mgmt | Priority value assigned to the circuit by management action. | |
| Load Class | The circuit's current capacity rating, derived from the current ECS member's load class values. | |
| Message Rates: | ||
| Sent | Count/rate of SCS messages sent over the circuit. | |
| Received | Count/rate that SCS messages are received on the circuit. | |
| Block Data (Kilobytes): | ||
| Mapped | Count/rate of kilobytes mapped for block data transfers over the circuit. | |
| Sent | Count/rate of kilobytes sent over the circuit using transfers. | |
| Requested | Count/rate of kilobytes requested from the remote port over the circuit using request block data transfers. | |
| Block Data (Count): | ||
| Sent | Count/rate of send block data transfers over the circuit. | |
| Requested | Count/rate of block data transfer requests sent over the circuit. | |
| Datagrams: | ||
| Sent | Count/rate of SCS datagrams sent over the circuit. | |
| Received | Count/rate of SCS datagrams received on the circuit. | |
| Credit Wait | Count/rate any connection on the circuit had to wait for a send credit. | |
| Buff Desc Wait | Count/rate any connection over the circuit had to wait for a buffer descriptor. | |
You can click the handle at the beginning of an SCA data row to display the following headings when they apply to a particular node:
To display SCS connections summary data, click the handle at the beginning of the "SCS Connections" row on the Cluster Summary pane (Figure 4-1). Figure 4-5 displays SCS Connections data information.
Figure 4-5 SCS Connections Data
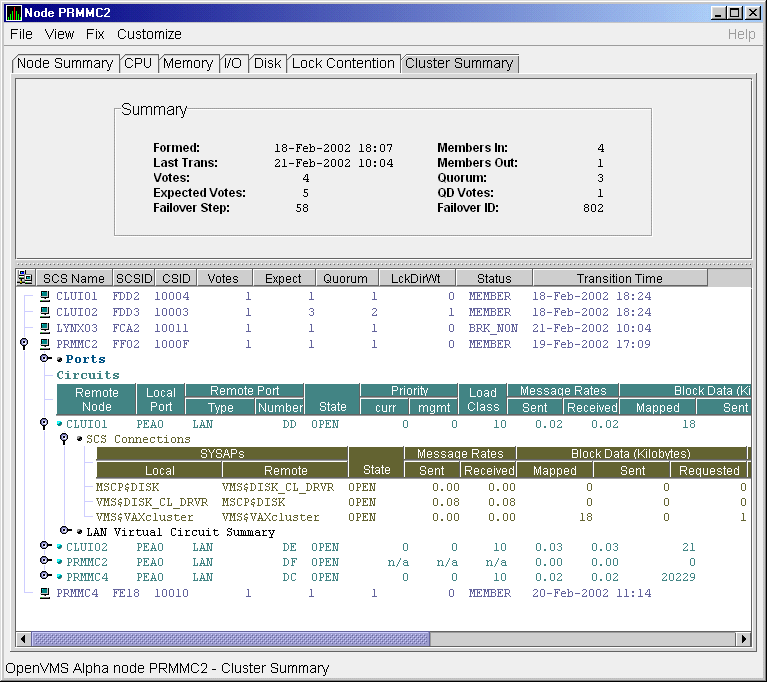
Table 4-5 describes the SCS connections data shown in Figure 4-5. Some of the data described in Table 4-5 is not displayed in Figure 4-5 because the screen display is wider than shown. You can scroll to the right on your terminal screen to display the remaining fields described in the table.
Note that connection count is the total number of events since the state of the connection changed to OPEN.
| Data | Description | |
|---|---|---|
| SYSAPs: | ||
| Local | Name of the SYSAP (system application) on the local system associated with the connection. | |
| Remote | Name of the SYSAP on the remote system associated with the connection. | |
| State |
The connection's current state. The possible items displayed are:
|
|
| Message Rates: | ||
| Sent | Count/rate that SCS messages are sent over the connection. | |
| Received | Count/rate that SCS messages are being received on the connection. | |
| Block Data (Kilobytes): | ||
| Mapped | Count/rate of kilobytes mapped for block data transfers by the local SYSAP using the connection. Note: This field is available only in raw data format. | |
| Sent | Number of kilobytes sent over the SCS connection by the local SYSAP using send block data transfers. | |
| Requested | Number of kilobytes requested over the SCS connection by the local SYSAP using request block data transfers. | |
| Block Data (Number): | ||
| Sent | Count/Rate of send block data transfers by this node over the SCS connection. | |
| Requested | Count/Rate of request block data transfers sent to the remote port over the SCS connection. | |
| Datagrams: | ||
| Sent | Count/Rate of datagrams sent on the SCS connection. | |
| Received | Count/Rate of datagrams received on the SCS connection. | |
| Credit Wait | Count/Rate of times the connection had to wait for a send credit. | |
| Buff Desc Wait | Count/Rate of times the connection had to wait for a buffer descriptor. | |
| Previous | Next | Contents | Index |