|
Authors:
Vivi Maurizio, SIAER, System & Development Technical Director
Turrini Giorgio, SIAER, Software Solution Architect, R&D Senior Consultant
Ghedini Vanna, SIAER, Data Base Administrator
Lotti Ermanno, SIAER, System Manager Supervisor
Guerri Stefano, SIAER, System Manager
Rosani Ornella, SIAER, Networking & Database Manager
Revisited by:
Vischio Giovanni, HP, OpenVMS Ambassador, Pre-Sales Technology & Solution Consultant
Early last year, SIAER, a long-time Italian
OpenVMS customer, began investigating the feasibility of a project to
consolidate server, storage, software applications, and Rdb databases along
with the renewal of its network IT infrastructure. In order to provide the
customer with the proof of concept that the global consolidation was possible
with the technology architecture we proposed, HP invited SIAER to the OpenVMS
Solution Center in Nashua, NH, to test its applications and database in a new
environment, representing a significant subset of the global consolidation.
After the visit, SIAER reported success from its tests
and great benefits from Oracle Rdb's Row Cache technology. SIAER provided us
with an exhaustive report of the trials and tests performed. This article
details the experiences of this customer in making use of an OpenVMS cluster
and Rdb's Row Cache feature to achieve great improvements in performance after
the consolidation process. This
article is another positive result of the HP and SIAER partnership.
S.I.A.E.R � Sistema Informativo Aziende Emilia
Romagna (Information System of Emilia Romagna Companies) � is a company founded
in 1981 (SIAER scarl, Via Malavolti, 5, 41100 Modena, Italy www.siaer.it). It has 60 employees and approximately 20
independent consultants. It plans and
develops software applications for financial and administrative functions of
companies (payroll, financial accounting, management control, business
relations with local and public government, bank, commercial institution, and
others) in an integrated environment of services, which provides a high level
of efficiency and achieves a solid and wide database of craftsmanship and
small-medium business companies. SIAER
works in a B2B environment and currently serves 15 associations (provinces),
mostly based in north central Italy; those associations belong to CNA, a
primary trade association agency (www.cna.it - www.er.cna.it).
SIAER
customers, in turn, provide services to approximately 80,000 firms and employ
more than 3,000 operators at local agencies (provinces). Furthermore, SIAER recently implemented SIR,
Sportello Istruttore di Rete, which allows users to interact within local and
central administrations; moreover, it put "On-line Services" in place for its
customers that allow companies to access web-based applications of the current
integrated environment of services.
SIAER developed a software application for benchmarking services for
Ecipar Emilia Romagna and started the implementation of EKO (Ecipar Knowledge
Organization), an ERP system for global management of educational services.
In
2001, SIAER, with the contribution of a major Italian telecommunication
carrier, built one of the wider broadband networks in Italy. In January 2003, with the HP and
TelecomItalia partnership, SIAER started the implementation of the IT
infrastructure renewal project: near its main office in Modena, SIAER built the
Data Center where all hardware infrastructure and software applications were
brought together through a process of server, storage, database and application
consolidation. During 2003, SIAER will provide its customers with desktop
management service and will assume the shape of one of the most important ASP
(Application Service Provider) in Italy.
SIAER's
President is Mr. Giorgio Allari; SIAER CEO is Mr. Lauro Venturi.
We would
like to thank the following people who spent time and effort to make this
document possible:
Aldo Priora, HP Italy: global organization
Vittorio Mezzano, HP Corp.: global organization
Giovanni Vischio, HP Italy: technical and logistic support
Craig Showers & OpenVMS Solutions Center Team in Nashua, HP Corp.: systems configuration and support
Bill Gettys, Oracle Corp.: Rdb support
Carlton Davis, HP Corp.: Rdb support
From the functional point of view, all services
supplied by SIAER work together; SiDist, a middleware component developed
in-house, provides the overall integration.
SiDist, based on a semantic model, maps objects
representation, consistency rules, and logic of the distributed model on a wide
number of approximately 200 Rdb/Oracle databases: SiDist manages the
distributed model based on a partial data replication. The project to
consolidate hardware infrastructure and software applications required changing
the SiDist distributed model to a centralized model: the Golem.
To
evaluate the feasibility of the server consolidation project, we conducted
performance and workload benchmark tests on an OpenVMS AlphaServer cluster (2 x
ES45) at the OpenVMS Solution Center in Nashua, NH (USA).
This testing was part of a
wider collaboration with OpenVMS Engineering started in March 2002 when the
SIAER CEO visited Nashua. Italian sales
and technical account managers later provided a preliminary global outsourcing
proposal in response to SIAER's request. This document and the related results
of the benchmark testing were prerequisites for a successful server
consolidation.
The
scope of the benchmark testing was to:
- Validate configuration and structural changes to the
main application program (SiDist) and to the Rdb database
- Check and validate the new environment (Golem) with an
up-to-date hardware and software system architecture
- Verify concurrent access to the unique Rdb
consolidated database by a large number of users.
Systems
and storage were available between July 8th and August 16th. Prior to July 28 we used systems for
experiments, unofficial tests, and preparing scripts and test data. We performed official tests between July 29th
and August 16th when SIAER personnel were available.
This
document contains two sections and an Appendix:
- The first section describes the benchmark setup,
preparation, and results
- The second section describes the tests performed,
system tools, system architecture, data collections, and results. The contents
of this section are fundamental to planning the future Golem implementation.
- The Appendix gives details of each test.
The
Environment
The
driving force behind this test was the server consolidation project that SIAER
planned for 2003.
The
current configuration is as follows:
Currently,
each location has a system and a database running locally; the software
application, SiDist, manages data replication and coherence. The future
configuration will be located in the "Datacenter," where a single system will
handle the workload of all the offices and the main province office; the
consolidation project foresees a single database instance called "Golem".
In
the current configuration, we have multiple databases with three kinds of data:
- GLOBAL:
shared between province and office and between offices (the percentage of
sharing between offices is around 10% � 336 tables)
- LOCAL:
each record in these tables is exclusively owned by one office; local data
exists also in the province office (228 tables)
- BROADCAST:
the same data is everywhere (147 tables)
Golem
will consolidate all the data on a single database. This change leads to the "Visibility problem"! Golem solves the
problem by introducing a table, called the "Visibility table", which correlates
the user with the data that can be viewed; this table allows more than one user
to view the same data. In the actual design, a single visibility table is used
to manage the visibility for a set of related tables; currently 17 tables are
used to manage visibility for 336 global tables.
Test
Structure
A
general overview of the benchmark shows two kind of process to be run:
- Main interactive processes (one or two
processes called A or Osservato) monitored by SIAER personnel using
general system and Rdb-specific tools.
- Many (0 to 500) workload processes (called
B or Disturb) in order to simulate an effective workload against the
systems.
We
ran both A Osservato processes and B Disturb processes and collected data about
system parameters and elapsed time; that data has been compared to results from
a test system (a DS20E) located in Italy at SIAER.
The
target of the test plan is to analyze the A Osservato process when we increase
the number of B Disturb processes.
|
A:
Osservato process: an interactive process simulating user activities at the
office.
B:
Disturb processes: workload processes simulating overall activities in a
typical office (usually batch processes about report and printing).
|
 |
|
We
collected system data and analyzed log files for each A Osservato process
running different workload conditions.
|
B
Disturb process, coded with specific SIAER language (SIC), the implementation
language of the SiDist main SAIER application, simulates back-office activities
typical at either local or main offices: read, modify, add, and delete of
records in the Golem database. To accurately simulate back-office tasks, we
also introduced "idle time" that emulates human activities (average idle time
was calculated from DTM (DEC Test Manager) sessions recorded at typical local
and main offices in Italy).
Back-office
tasks run against the Golem database to a limited extent (local office data),
but batch tasks (report, printing, and so forth) usually run against the whole
Golem database.
The
A Osservato process runs at the same time with different workloads (0 to 500
Disturb processes): we collected elapsed time from all sessions.
From
the system log, we estimated transactions of the systems, and from Rdb monitor
and log files we estimated transactions of the database. In both cases we determined an average
number of transactions per second calculated on a timeframe of 90 seconds while
A Osservato process and B Disturb processes were running.
July 15th to 26th
During these two weeks we gained access to
systems in Nashua and refined systems and executables as follows:
- Built
up and adjusted batch procedures and control statements.
- Made
changes to the main program (SiDist) to remove a record update used
specifically by the distributed model of SiDist.
- Improved
the algorithm for report generation.
- Developed
a detailed plan and schedule for the next two weeks, officially allocated
for test.
July 29th to August 2nd
Monday,
Tuesday, Wednesday:
A first step was performed with strange
results: we experienced several problems that badly altered results and the
assessment between simulated and real environment: priority, idle time, high
collision rate of database access. We made adjustments and procedure changes
and planned a new series of tests.
Thursday:
Due to network problems, the system was
inaccessible from Italy. Support teams in Nashua and HP and SIAER personnel
worked together on the problems. The problems were fixed Thursday evening, and
we planned new tests and batch sessions for that night.
Friday:
The DTM recorded session did not work
properly. A new session was recorded
and we ran tests TP1, TP2, TP3, TP4, TP5 Rdb: 80000 global buffers, no global
buffers in VLM. (See the appendix for all references to tests named TPx, TZx,
T�)
Summary after the first week:
Many
problems have been discovered: DTM recorded sessions are not reliable due to
many failures during execution.
A new strategy has been implemented.
We created two new processes, OSSERVATO and
OSSERVATO_L, which simulate human behavior; in detail:
- OSSERVATO: user session
on global data (company and related database structures)
- OSSERVATO_L: user
session on local data (local financial accounting)
Both processes execute standard operations on
specific database instances (updates, insert, delete) with idle time between
operations in order to simulate human activities.
Those changes do not alter the tests: we still
have A Osservato processes and B Disturb processes, and we still consider it to
be a new session when we increase B Disturb processes. The main change is the
Osservato processes: they are now executable and not recorded sessions.
August 5th to 9th
Monday:
Hardware and software were both reconfigured
for further test sessions (database and application server, cluster
configuration, and so forth); changes were made to batch procedures to have a
heavier workload (from 230 to 500 users � disturb processes).
Tuesday:
Ran tests TZ2, TZ3, TZ4, TZ5. Rdb: global buffers in VLM 524000, 700 per
user
Wednesday:
Ran tests TZ1 and TZ6.
Ran tests TDB1, TDB5, TDB7 with database
machine + global buffers in VLM 524000, 700 per
user
Thursday:
Used a new software configuration with row
cache; made changes to restore database procedures.
Ran tests TRC5, TRC7 database machine + row
cache + global buffers in VLM 524000, 700 per
user
Friday:
Ran a new software configuration with row
cache.
Ran test TRC7N: database machine + row cache +
global buffers in VLM 524000, 700 per
user
Summary
after second week:
The
changes made the system more robust, reliable, and stable; performance has been
increased. Tests ran as planned without problems in all configurations.
We achieved our planned goals. Due to high loads of work for the systems,
and for SIAER and HP people, we closed all sessions and the week after we
conducted manual tests and reorganized the data and database, collected log
files and results, etc.
As agreed early in July, systems and storage
were released to HP on August 18th.
August 19th to 27th
To compare test results with the current
production environment, we organized a test session with an internal system
(code name: Foa001). We used the same database and scripts with minor changes
due to different hardware (DS20). On August 27th, we ran Osservato
processes with a workload of disturb processes that simulated 25 and 35 users.
The
Technical Analysis of Benchmark (the second section of this document) details
processes and results. A more in-depth analysis needs more time and work, but
we have comments and information that could be made public, as follows:
The previous figure shows Osservato process
elapsed time (this process run against global data) in different
configurations. It may be interesting to look at the left side of the picture
where the results of the DS20 used locally in SIAER can be seen (it simulates
offices called Foa001).
The less favorable configuration is database
machine; there is no row cache and the result shows a breakpoint when we have
350 users (or disturb processes).
The other two configurations are better.
Note that the Osservato process is a heavy
workload for the system because it runs on global data.
The previous figure shows Osservato_l process
elapsed time (this process run against local data) in different configurations.
Look at left side of the picture where the results of the DS20 used locally in
SIAER can be seen (it simulate offices called Foa001).
All configurations are better than today.
Let's review the target and results of our
benchmark:
Validate
configuration and structural changes to the main application program (SiDist)
and to the Rdb database: this should enable us to implement a unique Rdb
database for each single area (province in Italy).
Functional tests were run before this
benchmark, but in our recent tests with new AlphaServer ES45 systems and MA8000
FC storage, the main program (SiDist) was stressed as never before: a heavy
workload of more than 500 users was simulated; note that 500 users are 70% of
the theoretic overall users of the Modena area. We did not find a single fault
or problem in either system architecture or database.
Check
and validate the new environment (Golem) with an up-to-date hardware and
software system architecture as included in the HP proposal, with the goal of
offering performance at least as good as users have today in the distributed
environment.
The Technical Analysis of Benchmark (the second
section of this document) fully details this target. Looking ahead, we found
that in all configurations we tested, Osservato processes ran faster than on
DS20's. We cannot say at this point
which is the best system architecture and configuration; it is possible that
changes to the database and SiDist code caused the performance improvements.
Verify
concurrent access to the unique Rdb consolidated database by a large number of
users.
This was the main concern we had before the
benchmark. The tests show that Rdb manages concurrent access in an excellent
way, and database-served queues contained few entries (20-30) at the worst
workload (>500 users simulated). The database table containing local
financial accounting was critical: tests on Osservato_l process do not show any
problems on concurrent access.
Here are some final comments:
- The
code and performance of the SiDist main application can be improved.
- The
performance of the Rdb database can be improved through reorganization.
Mr. Bill Gettys from Oracle Corp. in Nashua, after a quick review of our
architecture, said the Golem database could be considered a "very large
database"; for those databases, a correct architecture and organization is
absolutely necessary in order to gain better performance.
- The
Golem database has been robust and reliable in all workloads and conditions.
Golem crashed rarely, and the causes were immediately identified.
- The benchmark shows
that the application SiDist can be implemented in a consolidated
environment and that the HP proposal well matches application
requirements. Now that we have proven that the server and Rdb
consolidation can be implemented on HP architecture, we have to refine and
complete all applications.
This section describes how we implemented the
test strategy. We developed a set of
scripts using SiDist (file extension is .SIC) language; those scripts emulate
back-office activities inside local and main area CNA facilities based on a set
of data significant enough for testing. All test procedures and reports run in
batch mode on a specific queue with base priority 4 (the base priority OpenVMS
reserves for interactive processes).
Scripts execute
typical activities like record modify, add, delete on local data concerning the
local office itself. On the other side, we also have scripts and reports
running on global data and emulating the main area (province) offices. That is, the first set of scripts run local
data against the local database; the second set of scripts and reports run
global data against the "whole database"; they run in different configurations
in order to generate a workload of from 1 to 500 users.
At the same time, two specific procedures, both
named 'osservati', ran on the system and we monitored them with different
workloads (users) and collected the corresponding elapsed times. From log files we extracted interesting
details concerning overall activities that the system/cluster can perform;
also, using Rdb monitor tools, we collected from the whole database an average transactions
per second measured on a timeframe of 90 minutes during the execution of the
'osservati' processes.
As a first step, we executed two DTM
interactive procedures to test the system and collect details on transactions;
unfortunately, the DTM recorded interactive sessions were not reliable due to
problems in events synchronization. Therefore, we decided to change our
strategy as previously described.
The
cluster configuration contained the following hardware:
- ES45 (sia047), 16 GB memory, 4 CPU 1001MHz
- ES45 (sia048), 12 GB memory, 4 CPU 1001MHz
- MA8000 storage array with 5 volumes:
- $1$DGA200: 36 GB (2 x 18 GB disks stripe set)
- $1$DGA300: 36 GB (2 x 18 GB disks stripe set)
- $1$DGA400: 144 GB (8 x 18 GB disks stripe set)
- $1$DGA500: 72 GB (4 x 18 GB disks stripe set)
- $1$DGA800: 36 GB (2 x 18 GB disks stripe set)
We
also used the following equipment for communication and services purposes:
- DS20 (sia049); it operated as a DTM server and to
launch interactive sessions
- XP1000 (isvlab); it ran as a gateway between lab and
external internet access
- CISCO Firewall
From
SIAER facilities in Modena, Italy and Nashua Labs we had access via telnet with
triple authentication: Cisco, isvlab AlphaServer and ES45's cluster.
The
software configuration was as follows:
- OpenVMS
7.3 with XFC cache enable
- Oracle
Rdb v 7.1-02
- Data
monitor and collector PSDC
- SiDist
application with Golem support (global database):
- Local and global data access
- Query optimization (for report generation only)
- DCL
procedures to start test execution
- SiDist
procedures, as described in Table 1.
Table 1: Procedure Descriptions
|
Name
|
Description
|
|
Gol_ente_rag.sic
|
Add
and update of ENTE (company) record and related structures
|
|
Gol_ente_rag_nonew.sic
|
Update
of ENTE (company) record and related structures
|
|
Gol_pers_cognomi.sic
|
Add
and update of PERSONA (person) record and related structures
|
|
Gol_pers_nonew.sic
|
update
of PERSONA (person) record and related structures
|
|
Gol_genmov1.sic,
gol_genmov2.sic, gol_genmova.sic, gol_genmovb.sic, gol_genmovc.sic
|
Different
procedures to read and manage financial accounting record and data structure
|
|
Gol_crediti.sic
|
Read
CLIENTE_CNA record and add / update credits
|
|
Gol_f24.sic
|
Mining
of 'pkey' details for proxy payment
|
|
Gol_dett.sic
|
Add
and create invoices
|
|
Gol_righe.sic
|
Reading
and updating all financial accounting record for selected ENTE
|
|
Report
gol_tess.sic
|
Complex
report (iscritto, casind, impresa, albo_costruttore, auto_trasportatore, operatore_estero, esercente_commercio, tessera,artigiana, separata_sezione, commerciale, piccola_impresa)
|
|
Report
gol_repcon.sic
|
Simple
report
|
|
Report
gol_reppag.sic
|
Simple
report
|
|
Report
gol_prato.sic
|
Complex
report (iscritto, cliente_cna, impresa,sede, comuni, casind, contabilit�, mia, consulenza, cose, coge, coge_attivita, pa_mensile, paghe, istanza, artigiana, separata_sezione, piccola_impresa, commerciale)
|
We
used the set of scripts, procedures, and records as shown in Table 2.
Table 2: Sets of Procedures
|
Workload
|
Set of Scripts
|
|
Set
ONE (< 350 users, test 1,2,3,4 e 5)
|
- Ufficio
(7 procedures)
- 1
x Gol_ente_rag.sic
- 2
x Gol_ente_rag_nonew.sic
- 1
x Gol_pers_cognomi.sic
- 1
x Gol_pers_nonew.sic
- 2
x Gol_genmov[1|2].sic
- Provincia
(7 procedures)
- 1
x Gol_ente_rag_nonew.sic
- 2
x Gol_repcon.sic
- 2
x Gol_reppag.sic
- 2
x Gol_crediti.sic
- Unici
(5 reports and procedures)
- 1
x Gol_f24.sic
- 1
x Gol_righe.sic
- 1
x Gol_dett.sic
- 1
x Gol_prato.sic
- 1
x Gol_tess.sic
- Osservati
(2 procedures)
- 1
x Gol_osservato.sic
- 1
x Gol_osservato_l.sic
|
|
Set
TWO (~ 350 users, test 6)
|
- Ufficio
(9 procedures)
- 1
x Gol_ente_rag.sic
- 3
x Gol_ente_rag_nonew.sic
- 1
x Gol_pers_cognomi.sic
- 2
x Gol_pers_nonew.sic
- 1
x Gol_genmov[1|2].sic
- Provincia
(7 procedures)
- 1
x Gol_ente_rag_nonew.sic
- 2
x Gol_repcon.sic
- 2
x Gol_reppag.sic
- 2
x Gol_crediti.sic
- Unici
(5 reports and procedures)
- 1
x Gol_f24.sic
- 1
x Gol_righe.sic
- 1
x Gol_dett.sic
- 1
x Gol_prato.sic
- 1
x Gol_tess.sic
- Osservati
(2 procedures)
- 1
x Gol_osservato.sic
- 1
x Gol_osservato_l.sic
|
|
Set
THREE (~ 500 users, test 7)
|
- Ufficio
(13 procedures)
- 1
x Gol_ente_rag.sic
- 4
x Gol_ente_rag_nonew.sic
- 1
x Gol_pers_cognomi.sic
- 3
x Gol_pers_nonew.sic
- 3
x Gol_genmov[a|b|c].sic
- 1
x Gol_crediti.sic
- Provincia
(7 procedures)
- 1
x Gol_ente_rag_nonew.sic
- 2
x Gol_repcon.sic
- 2
x Gol_reppag.sic
- 2
x Gol_crediti.sic
- Unici
(5 reports and procedures)
- 1
x Gol_f24.sic
- 1
x Gol_righe.sic
- 1
x Gol_dett.sic
- 1
x Gol_prato.sic
- 1
x Gol_tess.sic
- Osservati
(2 procedures)
- 1
x Gol_osservato.sic
- 1
x Gol_osservato_l.sic
|
To
generate a correct workload, the amount of "set of scripts" was increased.
Table 3 shows the different workload types we used to test the whole
architecture.
Table 3: Workload Types
|
Workload Type
|
Procedures
|
Processes
|
|
1
|
No
workload
2
osservati
|
2
osservati
Total
2
|
|
2
|
7
local offices x 7 procedures Ufficio (49)
1
main offices x 7 procedures Provincia (7)
5
Unici (5)
2 osservati
|
61
disturb processes
2
osservati
Total
63
|
|
3
|
14
local offices x 7 procedures Ufficio (98)
2
main offices x 7 procedures Provincia (14)
5
unici (5)
2
osservati
|
117
disturb processes
2
osservati
Total
119
|
|
4
|
21
local offices x 7 procedures Ufficio (147)
3
main offices x 7 procedures Provincia (21)
5
Unici (5)
2
osservati
|
173
disturb processes
2
osservati
Total
175
|
|
5
|
28
local offices x 7 procedures Ufficio (196)
4
main offices x 7 procedures Provincia (28)
5
Unici (5)
2
osservati
|
229
disturb processes
2
osservati
Total
231
|
|
6
|
38
local offices x 9 procedures Ufficio (342)
1
main offices x 7 procedures Provincia (7)
5
Unici (5)
2
osservati
|
354
disturb processes
2
osservati
Total
356
|
|
7
|
38
local offices x 13 procedures Ufficio (494)
1
main offices x 7 procedures Provincia (7)
5
Unici (5)
2
osservati
|
506
disturb processes
2
osservati
Total
508
|
Table 4 shows the
architecture and system configuration models we used to run workload
procedures. The last digit in Test Name
indicates the corresponding workload as shown in Table 3; for example, TZ4
means we used workload number 4 from Table 3, which is 175 processes.
Table 4: Configuration Models
|
Configurations
|
Description
|
Test Name
|
|
P
|
Single
ES45 and Global Buffer in 32 bit memory (max. 81550 buffers)
|
Test
TP1, TP2, TP3, TP4 e TP5
|
|
Z
|
Single
ES45 and Global Buffers in VLM (max. 524000 buffers)
|
Test
TZ2, TZ3, TZ4, TZ5 e TZ6
|
|
DB
|
Application
server ES45 and database server ES45 with Global Buffers in VLM (max. 524000
buffers)
|
Test
TDB5 e TDB7
|
|
RC
|
Application
server ES45 and database server ES45 with Global Buffers in VLM (max. 524000
buffers) and row cache configuration type 1
|
Test
TRC5 e TRC7
|
|
RCN
|
Application
server ES45 and database server ES45 with Global Buffers in VLM (max. 524000
buffers) and row cache configuration type 2
|
Test
TRC7N
|
The
row cache configurations are shown in Table 5.
Table 5: Row Cache Configurations
|
Configuration
type 1: (326,707,172 byte RAM used)
|
Users = 700
|
SLOTS
|
LENGTH
|
WSSIZE
|
Tot.Mem
|
Phy.Mem
|
|
SIB003EE70001D04AA_VIS_IDX
|
13,000
|
430
|
10
|
6,417,828
|
6,416,416
|
|
SIB003EE7001E904AA_VIS_IDX
|
35,000
|
430
|
10
|
17,173,924
|
17,172,512
|
|
SIB003EE70001D04AA_PK_ENTITA
|
33,000
|
120
|
10
|
5,918,116
|
5,916,704
|
|
SIB003EE7001E904AA_PK_ENTITA
|
88,000
|
120
|
10
|
15,420,836
|
15,419,424
|
|
RDB$SYSTEM_AREA_CACHE
|
200,000
|
512
|
10
|
113,175,972
|
113,174,560
|
|
SIB003459000B404AC_IDX
|
19,000
|
450
|
10
|
9,743,780
|
9,742,368
|
|
SIB003459000BC04AC_IDX
|
13,000
|
450
|
10
|
6,679,972
|
6,678,560
|
|
SIB003EE70001D04AA
|
58,000
|
600
|
10
|
37,957,028
|
37,955,616
|
|
SIB003EE7000DC04AA
|
30,000
|
260
|
10
|
9,489,828
|
9,488,416
|
|
SIB003EE7001E904AA
|
130,000
|
360
|
10
|
53,685,668
|
53,684,256
|
|
SIB003EE7002E204AA
|
57,000
|
134
|
10
|
10,866,084
|
10,864,672
|
|
SIB003EE7002F404AA
|
50,000
|
232
|
10
|
14,372,260
|
14,370,848
|
|
SIB013A1E0B8E30A4A
|
14,000
|
200
|
10
|
3,640,740
|
3,639,328
|
|
SIB003EE7000DC04AA_PK_ENTITA
|
22,000
|
120
|
10
|
3,935,652
|
3,934,240
|
|
SIB003EE7002E204AA_PK_ENTITA
|
48,000
|
120
|
10
|
8,441,252
|
8,439,840
|
|
SIB003EE7002F404AA_PK_ENTITA
|
43,000
|
120
|
10
|
7,597,476
|
7,596,064
|
|
SIB013A1E0B8E30A4A_PK_ENTITA
|
12,000
|
120
|
10
|
2,190,756
|
2,189,344
|
|
|
Configuration
type 2: (396,374,224 byte RAM used)
|
Users = 700
|
SLOTS
|
LENGTH
|
WSSIZE
|
Tot.Mem
|
Phy.Mem
|
|
SIB003EE70001D04AA_VIS_IDX
|
13,000
|
430
|
10
|
6,417,828
|
6,416,416
|
|
SIB003EE7001E904AA_VIS_IDX
|
35,000
|
430
|
10
|
17,173,924
|
17,172,512
|
|
SIB003EE70001D04AA_PK_ENTITA
|
33,000
|
120
|
10
|
5,918,116
|
5,916,704
|
|
SIB003EE7001E904AA_PK_ENTITA
|
88,000
|
120
|
10
|
15,420,836
|
15,419,424
|
|
RDB$SYSTEM_AREA_CACHE
|
200,000
|
512
|
10
|
113,175,972
|
113,174,560
|
|
SIB003459000B404AC_IDX
|
19,000
|
450
|
10
|
9,743,780
|
9,742,368
|
|
SIB003459000BC04AC_IDX
|
13,000
|
450
|
10
|
6,679,972
|
6,678,560
|
|
SIB003EE70001D04AA
|
58,000
|
600
|
10
|
37,957,028
|
37,955,616
|
|
SIB003EE7000DC04AA
|
30,000
|
260
|
10
|
9,489,828
|
9,488,416
|
|
SIB003EE7001E904AA
|
130,000
|
360
|
10
|
53,685,668
|
53,684,256
|
|
SIB003EE7002E204AA
|
57,000
|
134
|
10
|
10,866,084
|
10,864,672
|
|
SIB003EE7002F404AA
|
50,000
|
232
|
10
|
14,372,260
|
14,370,848
|
|
SIB013A1E0B8E30A4A
|
14,000
|
200
|
10
|
3,640,740
|
3,639,328
|
|
SIB003EE7000DC04AA_PK_ENTITA
|
22,000
|
120
|
10
|
3,935,652
|
3,934,240
|
|
SIB003EE7002E204AA_PK_ENTITA
|
48,000
|
120
|
10
|
8,441,252
|
8,439,840
|
|
SIB003EE7002F404AA_PK_ENTITA
|
43,000
|
120
|
10
|
7,597,476
|
7,596,064
|
|
SIB013A1E0B8E30A4A_PK_ENTITA
|
12,000
|
120
|
10
|
2,190,756
|
2,189,344
|
|
SIDIST_HASH_BIS_CACHE
|
100,000
|
120
|
10
|
17,444,260
|
17,442,848
|
|
SIDIST_HASH_CACHE
|
200,000
|
120
|
10
|
34,778,532
|
34,777,120
|
|
SIDIST_HASH_LOCALI_CACHE
|
100,000
|
120
|
10
|
17,444,260
|
17,442,848
|
|
The
following list provides the cache names and related descriptions:
- Physical
caches in Table 6 (they include data corresponding to all record types in
the database)
Table 6: Physical Caches
|
RDB$SYSTEM_AREA_CACHE
|
Physical
Rdb system area
|
|
SIDIST_HASH_BIS_CACHE
|
Physical
area with HASH indexes
|
|
SIDIST_HASH_CACHE
|
Physical
area with HASH indexes
|
|
SIDIST_HASH_LOCALI_CACHE
|
Physical
area with HASH indexes
|
- Logical
caches in Table 7 (they include data corresponding to specific record type
in the database)
Table 7: Table and Index Caches
|
SIB003EE70001D04AA
|
Table
ENTE
|
|
SIB003459000B404AC_IDX
|
Index
on RAGIONE_SOCIALE of ENTE
|
|
SIB003EE70001D04AA_PK_ENTITA
|
Index
PK_ENTITA for ENTE
|
|
SIB003EE70001D04AA_VIS_IDX
|
Visibility
index of hierarchy ENTE
|
|
SIB003EE7000DC04AA
|
Table
CLIENTE_CNA
|
|
SIB003EE7000DC04AA_PK_ENTITA
|
Index
PK_ENTITA of CLIENTE_CNA
|
|
SIB003EE7001E904AA
|
Table
PERSONA
|
|
SIB003459000BC04AC_IDX
|
Index
on COGNOME of PERSONA
|
|
SIB003EE7001E904AA_PK_ENTITA
|
Index
PK_ENTITA for PERSONA
|
|
SIB003EE7001E904AA_VIS_IDX
|
Visibility
index of hierarchy PERSONA
|
|
SIB003EE7002E204AA
|
Table
CLIENTE_P
|
|
SIB003EE7002E204AA_PK_ENTITA
|
Index
PK_ENTITA of CLIENTE_P
|
|
SIB003EE7002F404AA
|
Table
DR_PERSONA
|
|
SIB003EE7002F404AA_PK_ENTITA
|
Index
PK_ENTITA of DR_PERSONA
|
|
SIB013A1E0B8E30A4A
|
Table
CONTABILITA
|
|
SIB013A1E0B8E30A4A_PK_ENTITA
|
Index
PK_ENTITA of CONTABILITA
|
The following figures and tables show all the
results we gathered from tests. For detailed information on the tests, see the
Appendix.
Figures
1, 2, 3, and 4 show the details collected from the tests.
Figure 1 shows transaction per second, as Oracle Rdb monitor
tool reports, for different workloads.
Configurations are shown in colors, see legend aside. We reported also
the comparison system we used locally: (TC: comparison test).
Note
that only the configuration with a global buffer in VLM @ 524000 and single
ES45 (TZ) runs tests 2, 3, 4, and 6 (corresponding to 63, 119, 175 e 356
disturb processes); configurations with database server, with or without row
cache (TDB e TRC), run tests 5 and 7 (231 and 508 disturb processes). Test 5
(231 disturb processes) has been used against configurations TZ, TDB e TRC. The
configurations with database server, with row cache type 2, run test 7 only
(508 processes).
We'll
use TPSS name in order to show TPS (Transactions per second) for workload on
SiDist main application.
Figure
1: Transaction per Second at a Different Workload (Disturb Processes)
 In Figure
1, note that TPSS has a linear increase on TZ
configuration up to test 4 (178 processes); then, it shows a nonlinear curve,
meaning that this configuration cannot support a heavier workload. If we highlight the configuration with row
cache, it shows a linear growth, like a straight line; if we take only the line
portions of tests 1, 2, 3, and 4 for TZ, test 5 for TRCm, and test 7 for TRCN,
we will obtain the results in Figure 2. In Figure
1, note that TPSS has a linear increase on TZ
configuration up to test 4 (178 processes); then, it shows a nonlinear curve,
meaning that this configuration cannot support a heavier workload. If we highlight the configuration with row
cache, it shows a linear growth, like a straight line; if we take only the line
portions of tests 1, 2, 3, and 4 for TZ, test 5 for TRCm, and test 7 for TRCN,
we will obtain the results in Figure 2.
Figure 2:
Trend of Better Results at a
Different Workload (Disturb Processes)
Figure
2 shows a linear curve of TPSS; the configuration with database machine and row
cache is the best configuration because it keeps a linear growth at different
workload, higher included (508 disturb processes). Also note in this figure
that Migliori in the key means "Top of Series."
Figure 3 shows the
amount of TPSS per single process (average). We have a very low decline of
performances.
Figure 3:
TPSS per Process at a Different Workload
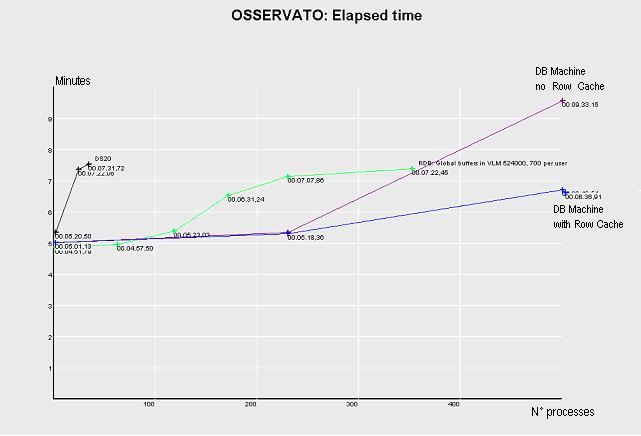
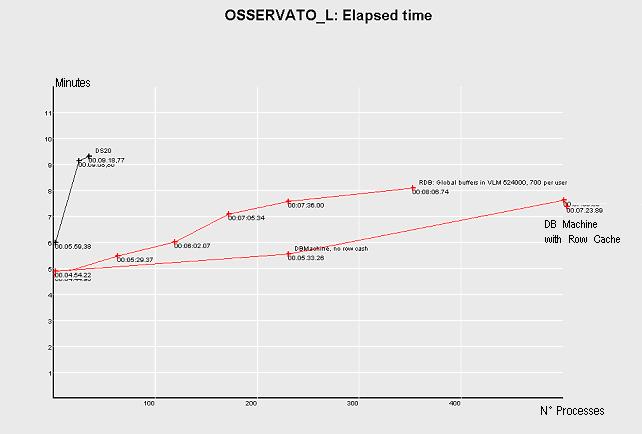
Figure 4: Elapsed time of OSSERVATO_L Process at a
Different Workload
Figure
4 and Figure 5 show the elapsed time for
"OSSERVATI" processes on different workloads. Note the elapsed time of
"OSSERVATI" processes on the configuration named RCN (the database machine with
row cache type 2) and 508 disturb processes. It is clearly less than the
elapsed time on the comparison test system (DS20E) with fewer disturb processes
(only 25).
OSSERVATO_L: 07:23:89 versus 09:18:77
OSSERVATO: 06:36:91 versus 07:22:06
We
may confirm the configuration used for benchmark is better than one we used on
our offices; it reacts fine even with higher workload on global data.
-
Figure
5: Elapsed time of the OSSERVATO Process on a Different Workload
We
also collected a number of transactions on different workloads. The data
collected were: ENTE creation, update of ENTE and related data structure,
PERSONE creation and update, and ACTIVITIES creation.
We normalized transaction data to a one-hour
period in order to compare data collected from the benchmark system and
comparison test system.
Tests loading and running really penalize the
normalization of test results. In fact, tests with a large number of disturb
processes have been activated in more than one shot because the server, which
handles the generation of disturb processes, did not allow more than 200
disturb processes to start at a time. Therefore, tests with 231 and 356
processes were loaded in two steps and tests with 508 processes were loaded in
three steps. In Table 8, start time is related to start time of the last step.
We also had difficulties in killing all disturb processes not stopping by
themselves as the procedures should do; this may generate some very limited
uncertainty in collected results.
Table 8: Transaction Data: Elapsed Time on Different Tests
|
|
|
|
|
|
ENTE
|
PERSONE
|
ACTIVITIES
|
|
Test
|
Processes
|
Start
|
End
|
Elapsed
|
Creation
|
Update
|
Creation
|
Update
|
Creation
|
|
TP2
|
61
|
08:09:43
|
09:15:43
|
01:06:00
|
29
|
827
|
26
|
1319
|
5704
|
|
TP3
|
117
|
09:26:18
|
10:02:31
|
00:36:13
|
44
|
984
|
34
|
1454
|
5874
|
|
TP4
|
173
|
10:50:20
|
11:30:38
|
00:40:18
|
18
|
980
|
32
|
1602
|
6150
|
|
TP5
|
229
|
11:32:10
|
12:30:00
|
00:57:50
|
0
|
1907
|
62
|
3327
|
13901
|
|
|
|
|
|
|
|
|
|
|
|
|
TZ2
|
63
|
11:06:01
|
11:41:46
|
00:35:45
|
28
|
501
|
14
|
737
|
3056
|
|
TZ3
|
119
|
11:45:19
|
12:22:45
|
00:37:26
|
52
|
1011
|
33
|
1484
|
5982
|
|
TZ4
|
172
|
08:29:13
|
09:06:50
|
00:37:37
|
70
|
1377
|
44
|
1987
|
7784
|
|
TZ5
|
233
|
10:16:43
|
11:01:35
|
00:44:52
|
111
|
2105
|
72
|
2951
|
11708
|
|
TZ6
|
353
|
04:17:25
|
05:06:00
|
00:48:35
|
141
|
3997
|
92
|
6475
|
13834
|
|
|
|
|
|
|
|
|
|
|
|
|
TDB5
|
233
|
07:52:00
|
08:36:00
|
00:44:00
|
95
|
2224
|
72
|
3199
|
13298
|
|
TDB7
|
501
|
10:40:00
|
11:33:00
|
00:53:00
|
274
|
4497
|
81
|
7238
|
19392
|
|
|
|
|
|
|
|
|
|
|
|
|
TRC5
|
231
|
09:27:02
|
10:07:06
|
00:40:04
|
97
|
2387
|
71
|
3574
|
14514
|
|
TRC7
|
501
|
11:19:52
|
12:01:20
|
00:41:28
|
136
|
4866
|
94
|
8690
|
20840
|
|
TRC7N
|
504
|
08:12:01
|
08:54:04
|
00:42:59
|
150
|
4826
|
109
|
8899
|
21433
|
|
|
|
|
|
|
|
|
|
|
|
|
TC2
|
25
|
13:41:28
|
14:30:15
|
00:48:47
|
4
|
166
|
2
|
402
|
1082
|
|
TC3
|
35
|
16:22:00
|
17:16:18
|
00:54:18
|
4
|
318
|
3
|
741
|
1092
|
Table
9: Transaction Data: Elapsed @ different tests and normalized @ 1 hour
|
|
|
ENTE
|
PERSONE
|
ACTIVITIES
|
|
Test
|
Processes
|
Creation
|
Update
|
Creation
|
Update
|
Creation
|
|
TP2
|
61
|
26.4
|
751.8
|
23.6
|
1,199.1
|
5,185.5
|
|
TP3
|
117
|
72.9
|
1,630.2
|
56.3
|
2,408.8
|
9,731.4
|
|
TP4
|
173
|
26.8
|
1,459.1
|
47.6
|
2,385.1
|
9,156.3
|
|
TP5
|
229
|
0.0
|
1,978.4
|
64.3
|
3,451.6
|
14,421.8
|
|
|
|
|
|
|
|
|
|
TZ2
|
63
|
47.0
|
840.8
|
23.5
|
1,236.9
|
5,129.0
|
|
TZ3
|
119
|
83.3
|
1,620.5
|
52.9
|
2,378.6
|
9,588.2
|
|
TZ4
|
172
|
111.7
|
2,196.4
|
70.2
|
3,169.3
|
12,415.8
|
|
TZ5
|
233
|
148.4
|
2,815.0
|
96.3
|
3,946.4
|
15,657.1
|
|
TZ6
|
353
|
174.1
|
4,936.3
|
113.6
|
7,996.6
|
17,084.9
|
|
|
|
|
|
|
|
|
|
TDB5
|
233
|
129.5
|
3,032.7
|
98.2
|
4,362.3
|
18,133.6
|
|
TDB7
|
501
|
310.2
|
5,090.9
|
91.7
|
8,194.0
|
21,953.2
|
|
|
|
|
|
|
|
|
|
TRC5
|
231
|
145.3
|
3,574.5
|
106.3
|
5,352.1
|
21,734.8
|
|
TRC7
|
501
|
196.8
|
7,040.8
|
136.0
|
12,574.0
|
30,154.3
|
|
TRC7N
|
504
|
214.0
|
6,886.1
|
155.5
|
12,697.7
|
30,582.2
|
|
|
|
|
|
|
|
|
|
TC2
|
25
|
4.9
|
204.2
|
2.5
|
494.4
|
1,330.8
|
|
TC3
|
35
|
4.4
|
351.4
|
3.3
|
818.8
|
1,206.6
|
To
compare the results between the benchmark and the comparison test (TC2, TC3),
we projected the number of processes to 500, as shown in Table 10.
Table 10: 500 Processes Projection
|
|
|
ENTE
|
PERSONE
|
ACTIVITIES
|
|
Test
|
Processes
|
Creation
|
Update
|
Creation
|
Update
|
Creation
|
|
TC2
|
500
|
98.4
|
4,083.4
|
49.2
|
9,888.6
|
26,615.6
|
|
TC3
|
500
|
63.1
|
5,019.7
|
47.4
|
11,696.9
|
17,237.6
|
Note
that the configuration we tested in Nashua shows better performance at all
times with any kind of workload than the comparison test system at the office.
The
Rdb database created on-site at SIAER before our visit to Nashua is the full
Modena database; Modena (a province inside the Emilia-Romagna region) has the
largest and most populated database of the region. We reorganized the database
because after the first tests we discovered a bad organization of the data:
excessive fragmented record rate, and a slowness in inserting record operation
due to excessive check on database pages. After the reorganization, we
experienced better performance. To test different configurations, the Modena
database was modified. We changed the parameter related to global buffer
allocation (total number of global buffers, global buffers per process, memory
location, and so on) and created Row Caches. Row Caches were allocated taking
care of two topics:
- The database analysis told us the record sizing and
allocation
- The knowledge of applications helped us identify where
and how Row Caches have to be applied.
We
did not perform any optimization on indexes; we used the original ones at
database creation before visiting Nashua.
The
entire database was loaded on a single volume of storage array MA8000; it
performed fine in any test. The I/O
rate of the database has been always lower than the I/O rate of the disks where
application data (called KB inside SIAER applications) are stored: the I/O rate
was between 800 and 900 I/O per second on the database disk for the test with
largest number of disturb processes.
All
tests validated the proposed configuration.
This architecture can carry the workload of the biggest province (see
database), Modena, performing better than the current smaller databases at
local offices.
If
we look at the results, the better configuration is to have separate database
and application systems - a database machine and an application machine - with
row cache: this configuration provided significant performance increases.
The
presence of the "visibility table," a new table we included specifically for
the database consolidation, adds one more join level for each record (ENTE,
PERSONA, ACTIVITIES); that makes the search operations across the overall
database more expensive in contrast to performing current search operations on
single and smaller databases located at each local offices.
The
use of row cache on the "visibility table" makes the difference, because we do
not perform any I/O. The usage of PK_ENTITA, as a sorted index, for search
operations (RAGIONE_SOCIALE, COGNOME) in the database, is performed without
accessing the records and avoids heavy I/O. Otherwise, any search operation
could involve a huge number of tables. In those cases, splitting the query into
two or more queries and using fewer tables for each query provides better
performance.
A
simple consideration we did after the benchmark, and one we are investigating
now, is to consolidate the 180 single/local databases into 15 databases. The
number of provinces (Modena is one of them and has the biggest database after
consolidation) requires more attention on how queries are performed because a
"not optimized" query may create bad performances. As stated earlier, the
consolidated database of the test province of Modena is approximately 100 GB. A
specific guideline will be provided to SIAER programmers in order to optimize
the code of applications due to huge dimension of many tables inside the consolidated
database (Golem).
We
are reviewing the following recommendations to revise the final SiDist
application in the new consolidated environment:
- Database configuration and
management: In creating a single
consolidated database from 15 databases, some of them approximately 80-100
GB, it is extremely important to have the correct configuration of the
database as well as to test and validate all applications involved. Our experience showed that an
application that runs fine in a distributed environment with many smaller
databases may have performance problems running in a single consolidated
database.
- Security:
Security is more critical for a consolidated database. A security problem on a local database
can generate a corruption or loss of data only in a single office; for a
consolidated database the consequences can be much greater. We are
planning a "security project" in the near future because of this issue
and, because we are also developing external Web-based applications running
together with existing applications and databases. All the data we manage is sensitive
data, confidential and classified, and requires the implementation of a
secure environment.
- Applications: We will review the current set of applications in relation
to the following criteria when they run with the single large database:
- Query optimization:
prudent and cautious usage of the "visibility table", key factors for
faster and wider queries, and security of data management
- Re-use of compiled
queries, dynamic query optimization
- Assure security on
data access and on qualification of database operation.
In
this appendix you will find details of the tests we performed and discussed in
this document. Note that in the beginning tests were performed by some recorded
(using DTM) interactive session, but we discontinued these later due to the
instability of the DTM recorded operation.
We used the terminology TPSS to mean
transactions per second as reported by the database monitor process. The
database monitor collects data for a 90-second time frame when "osservati"
processes run.
"Launch
end" means times when all batch disturb processes are up and running (each
batch log reports start-time of processes).
"Test
end" means when all disturb processes completed or, for some processes, when
they have been killed.
With
the single system, named Sia047 (16 GB, 4 CPU), and the database configured
with 81550 global buffer in 32-bit system memory, we ran tests with
configurations 2, 3, 4 and 5 of Table
3. For each configuration, user buffers were allocated
when the database was opened in order to allow connections to "disturb"
processes. The results are as follows:
TP2
Date: August 2, 2002
Configuration: 2 (Table 3), P (Table 4)
User DTM1: PPROD01
User DTM2: PPROD50
User "osservati": PPROD04
Launch start: 08:09:43
Launch end: 08:12:05
Launch DTM: 08:13:23
Launch Osservati: 08:13:57
Test end: 09:15:43
TPSS: 14.2 (with 63 active processes)
TP3
Date: August 2, 2002
Configuration: 3 (Table 3), P (Table 4)
User DTM1: PPROD01
User DTM2: PPROD50
User "osservati": PPROD04
Launch start: 09:26:18
Launch end: 09:29:31
Launch DTM: 09:29:44
Launch Osservati: 09:52:33
Test end: 10:02:31
TPSS: 24.1 (with 119 active processes)
TP4
Date: August 2, 2002
Configuration: 4 (Table 3), P (Table 4)
User DTM1: PPROD01
User DTM2: PPROD50
User "osservati": PPROD04
Launch start: 10:50:20
Launch end: 10:55:17
Launch DTM: 10:55:20
Launch osservati: 10:55:20
Fine DTM: 11:18:02
Test end: 11:30:38
TPSS: 32.2 (with 175 active processes)
TP5
Date: August 2, 2002
Configuration: 5 (Table 3), P (Table 4)
User DTM1: PPROD01
User DTM2: PPROD50
User "osservati": PPROD04
Launch start: 11:32:10
Launch end: 11:44:24
Launch DTM: 11:44:44
Launch osservati: 11:44:44
Test end: 12:30:00
TPSS: 39.5 (with 231 active processes)
With
the single system Sia047 (16 GB, 4 CPU) and the database configured with 524000
global buffer in 64bit system memory (VLM: Very Large Memory), we ran tests
with configuration 1, 2, 3, 4, 5, and 6 of Table
3. For each configuration, we allocated 700 buffers per
user. The results are as follows:
TZ1
Date: August 7, 2002
Configuration: 1 (Table 3), Z (Table 4)
Partial collection on "Osservati processes"
Test start: 03:43:01
Test end: 03:47:52
TZ2 (version TZ2B)
Date: August 6, 2002
Configuration: 2 (Table 3), Z (Table 4)
User "osservati": PPROD04
Launch start: 11:06:01
Launch end: 11:07:35
Launch osservati: 11:09:14
Test closing: 11:39:45
Test end: 11:41:46
TPSS: 12.5 (with 63 active processes)
TZ3 (version TZ3B)
Date: August 6, 2002
Configuration: 3 (Table 3), Z (Table 4)
User "osservati": PPROD04
Launch start: 11:45:19
Launch end: 11:46:34
Launch osservati: 11:49:55
Test closing: 12:20:39
Test end: 12:22:45
TPSS: 25.5 (with 119 active processes)
TZ4 (version TZ4B)
Date: August 6, 2002
Configuration: 4 (Table 3), Z (Table 4)
User "osservati": PPROD04
Launch start: 08:29:13
Launch end: 08:31:20
Launch osservati: 08:41:13
Test closing: 09:02:39
Test end: 09:06:47
TPSS: 37.0 (with 175 active processes)
TZ5
Date: August 6, 2002
Configuration: 5 (Table 3), Z (Table 4)
User "osservati": PPROD04
Launch start part 1: 10:16:43
Launch end part 1: 10:20:00
Launch start part 2: 10:24:04
Launch end part 2: 10:24:54
Launch osservati: 10:27:40
Test closing: 10:56:06
Test end: 11:01:40
TPSS: 45.1 (with 231 active processes)
TZ6
Date: August 7, 2002
Configuration: 6 (Table 3), Z (Table 4)
User "osservati": PPROD04
Launch start part 1: 04:11:15
Launch end part 1: 04:13:05
Part 1 processes active at: 04:16:05
Launch start part 2: 04:17:25
Launch end part 2: 04:19:10
Part 2 processes active at: 04:25:27
Launch osservati: 04:26:39
Osservati processes active at: 04:27:55
Test closing: 05:00:00
Test end: 05:06:00
TPSS: 61.2 (with 356 active processes)
With
the system Sia047 (16 GB, 4 CPU) configured as the application server and the
second system, named Sia048 (12 GB, 4 CPU) configured as the database server,
and the database configured with 524000 global buffer in 64-bit system memory
(VLM: Very Large Memory), we ran tests with configuration 1, 5, and 7 of Table 3. For each configuration, we allocated 700 buffers
per user.
TDB1
Date: August 7, 2002
Configuration: 1 (Table 3), Z (Table 4)
Partial collection on "Osservati processes"
Test start: 07:36:48
Test end: 07:41:49
TDB5
Date: August 7, 2002
Configuration: 5 (Table 3), DB (Table 4)
User "osservati": PPROD04
Launch start part 1: 07:52:00
Launch end part 1: 07:54:33
Part 1 processes active at: 07:55:33
Launch start part 2: 07:56:32
Launch end part 2: 07:57:34
Part 2 processes active at: 07:58:40
Launch osservati: 07:59:43
Osservati processes active at: 08:00:58
Test closing: 08:30:50
Test end: 08:35:38
TPSS: 48.8 (with 231 active processes)
TDB7
Date: August 7, 2002
Configuration: 7 (Table 3), DB (Table 4)
User "osservati": PPROD04
Launch start part 1: 10:40:05
Launch end part 1: 10:41:44
Part 1 processes active at: 10:42:56
Launch start part 2: 10:44:18
Launch end part 2: 10:45:47
Part 2 processes active at: 10:47:50
Launch start part 3: 10:49:06
Launch end part 3: 10:51:07
Part 3 processes active at: 10:55:23
Launch osservati: 10:55:27
Osservati processes active at: 10:56:34
Test closing: 11:29:49
Test end: 11:33:53
TPSS: 79.8 (with 508 active processes)
With
the system Sia047 (16 GB, 4 CPU) configured as the application server and the
second system Sia048 (12GB, 4CPU) configured as the database server, and the
database configured with 524000 global buffers in 64-bit system memory (VLM:
Very Large Memory) and two specific row cache configurations in VLM (see Table 5), we ran tests with configurations 5 and 7 of Table 3. For each configuration, we allocated 700 buffers per
user.
TRC5
Date: August 8, 2002
Configuration: 5 (Table 3), RC (Table 4)
User "osservati": PPROD04
Launch start part 1: 09:21:36
Launch end part 1: 09:24:09
Part 1 processes active at: 09:25:56
Launch start part 2: 09:27:02
Launch end part 2: 09:30:04
Part 2 processes active at: 09:30:58
Launch osservati: 09:32:30
Osservati processes active at: 09:33:44
Test closing: 10:04:10
Test end: 10:07:06
TPSS: 49.0 (with 231 active processes)
TRC7
Date: August 8, 2002
Configuration: 7 (Table 3), RC (Table 4)
User "osservati": PPROD04
Launch start part 1: 11:10:00
Launch end part 1: 11:11:38
Part 1 processes active at: 11:14:11
Launch start part 2: 11:15:22
Launch end part 2: 11:16:55
Part 2 processes active at: 11:19:00
Launch start part 3: 11:19:52
Launch end part 3: 11:22:03
Part 3 processes active at: 11:26:46
Launch osservati: 11:27:58
Osservati processes active at: 11:29:33
Test closing: 11:58:25
Test end: 12:01:20
TPSS: 93.1 (with 508 active processes)
TRC7N
Date: August 9, 2002
Configuration: 7 (Table 3), RCN (Table 4)
User "osservati": PPROD04
Launch start part 1: 08:02:31
Launch end part 1: 08:04:16
Part 1 processes active at: 08:06:07
Launch start part 2: 08:07:14
Launch end part 2: 08:08:48
Part 2 processes active at: 08:10:07
Launch start part 3: 08:12:01
Launch end part 3: 08:14:05
Part 3 processes active at: 08:18:58
Launch osservati: 08:20:04
Osservati processes active at: 08:21:16
Test closing: 08:50:59
Test end: 08:54:04
TPSS: 97.8 (with 508 active processes)
To
better evaluate results, we got ready a comparison system that looks like a
typical system at local offices (Foa001); it's a DS20 single CPU@500MHz
processor and 1GB memory; disks are as follows:
- DKA0
(9GB) OpenVMS operating system and layered products
- DKA100
(9GB) database: user data
- DKA200
(36GB) application: user space - database: root file
- DKA300
(36GB) not used
- DKC0
(18GB) database: rdb$system space, user space
- DKC100
(36GB) database: RUJ
- DKC200
(36GB) database: user space
The comparison system refers to a local office
with a number of users between 25 and 35; we adjusted the scripts launching
"disturb" processes in order to emulate a typical office workload and related
number of users. Osservati processes remains as before.
Table 11: Comparison Test Configuration
|
Configuration
TC1 (2 users)
|
- Only
Osservati Processes (2 procedures)
- 1
x Gol_osservato.sic
- 1
x Gol_osservato_l.sic
|
|
Configuration
TC2 (25 users)
|
- Disturb
Processes Ufficio (23 procedures)
- 1
x Gol_ente_rag.sic
- 5
x Gol_ente_rag_nonew.sic
- 1
x Gol_pers_cognomi.sic
- 5
x Gol_pers_nonew.sic
- 5
x Gol_genmovu[1|2|3|4|5].sic
- 1
x Gol_repcon.sic
- 1
x Gol_reppag.sic
- 4
x Gol_crediti.sic
- Osservati
Processes (2 procedures)
- 1
x Gol_osservato.sic
- 1
x Gol_osservato_l.sic
|
|
Configuration
TC3 (35 users)
|
- Disturb
Processes Ufficio (33 procedures)
- 1
x Gol_ente_rag.sic
- 10
x Gol_ente_rag_nonew.sic
- 1
x Gol_pers_cognomi.sic
- 10
x Gol_pers_nonew.sic
- 5
x Gol_genmovu[1|2|3|4|5].sic
- 1
x Gol_repcon.sic
- 1
x Gol_reppag.sic
- 4
x Gol_crediti.sic
- Osservati
Processes (2 procedures)
- 1
x Gol_osservato.sic
- 1
x Gol_osservato_l.sic
|
Comparison
tests provided the following results:
|
|
|
|
|
ENTE
|
PERSONE
|
ACTIVITIES
|
OSSERVATO
|
OSSERVATO_L
|
|
test
|
date
|
start
|
end
|
creation
|
update
|
creation
|
update
|
creation
|
elapsed
|
CPU
|
elapsed
|
CPU
|
|
Tc1
|
27/08
|
|
|
|
|
|
|
|
05:20.50
|
03.90
|
05:59.38
|
09.53
|
|
Tc2
|
27/08
|
13:41:28
|
14:30:15
|
4
|
166
|
2
|
402
|
1082
|
07:22.06
|
04.55
|
09:08.86
|
10.96
|
|
Tc3
|
27/08
|
16:22:00
|
17:16:18
|
4
|
318
|
3
|
741
|
1092
|
07:31.72
|
04.71
|
09:18.77
|
11.45
|
Tests
run on local DS20 single CPU processor running at 500 Mhz and 1 GB memory.
TC1
Partial collection on "Osservati processes"

TC2
Date: August 27, 2002
Configuration: 2 (Table 8)
User "osservati": PPROD04
Launch start: 13:41:28
Launch end: 13:41:37
Processes active at: 13:48:39
Launch osservati: 13:48:42
Osservati processes active at: 13:51:02
Test closing: 14:29:13
Test end: 14:30:15
TPSS: 5.1 (with 25 active processes)


TC3
Date: August 27, 2002
Configuration: 3 (Table 8)
User "osservati": PPROD04
Launch start: 16:22:00
Launch end: 16:22:04
Processes active at: 16:32:08
Launch osservati: 16:32:25
Osservati processes active at: 16:35:28
Test closing: 17:14:40
Test end: 17:16:18
TPSS: 6.0 (with 35 active processes)
|