 |
» |
|
|
 |
 |
|
 |
 |
It began three years ago with
the creation of a timeline data extraction tool named T4 (Total Timeline
Tracking Tool). T4 converted previously recorded MONITOR data into a reusable text
file in Comma Separated Value (CSV) format. Since then, HP OpenVMS
Engineering has been evolving, improving, and extending the value of T4. For example, we created a T4 kit that added
vital timeline data from other independent sources to the generated MONITOR
data. We continued by developing an interconnected series of timeline-driven
tools, techniques, and tables that help extract the maximum value from the
timeline data. These included features for automating the creation of detailed
timeline history, for synchronizing performance data captured from independent
sources, for readily adding new timeline collector sources, and for rapidly
visualizing and reporting on timeline behavior.
This growing collection of
cooperative capabilities has proven to be universal in scope and readily
extendable while fostering and encouraging a collaborative approach to any
performance situation. These
developments, now codenamed T4 &
Friends, have produced visible productivity improvements and dramatic
time-saving for OpenVMS Engineering's performance efforts including our
extensive cooperative performance work with customers and partners. T4 & Friends is all about the time
efficient creation and use of timelines including: their capture, charting,
synchronization, comparison, visualization, sharing and especially
collaboration.
|
 |
TimeLine Collaboration (TLC) Format |
 |
 |
|
The T4 & Friends approach has, as its central core, a single,
common, uncomplicated, universal format that we have chosen for representing
the timeline statistical values that have been collected or extracted. We refer to this as TimeLine Collaboration (TLC) format. The T4
extractor for MONITOR data generates TLC output. In addition to its extractor for MONITOR data, the T4V3x kit now
includes five other collectors and extractors.
Each generates output in TLC-format.
Better yet, any upstream
collector or extractor can do the same and readily store its vital timeline
data in TLC-format. These will be the
upstream "Friends of T4". There are also downstream "Friends
of T4" that take TLC-format data and carry out value-adding actions such as
synchronizing data from independent sources, visualizing timeline changes,
comparing data from two different time periods, applying expert rules, or
graphically reporting results.
|
Widening Use Among the OpenVMS Community |
 |
 |
|
Not surprisingly, a growing
number of OpenVMS customers and partners have seen these benefits first hand
and have begun to follow our lead. They
have done this by turning on their own historical timeline data collection, by
generating data in TLC-format (beginning with the base T4V3x kit), by turning
on their own new collectors or extractors that generate TLC-format data, and by
structuring their own unique timeline-driven approach.
Components of our T4 & Friends developments and growing
banks of historical data in the core TLC-format
are now routinely employed on some of the largest, most important OpenVMS
production systems around the world including vital systems receiving our
highest Gold and Platinum Support Levels.
|
Access to the T4V3x Kits |
 |
 |
|
The latest T4V33 kit that
supports creation of historical timeline data now ships with OpenVMS Alpha
Version 7.3-2 making this essential foundation block for collaborative,
timeline-driven performance work more readily and widely accessible in 2004 to
OpenVMS customers. The T4V32 kit is
available for public web download for those running earlier versions of OpenVMS
on AlphaServer systems. For many, the
easiest way to obtain T4's capabilities is to use HP Services' System Health Check (SHC) offering for OpenVMS. SHC now includes a T4-driven collection of TLC-format
data coupled with a growing list of expert rules that assess system performance
health based on that data.
|
Timelines Are Key. Timelines Apply Universally. |
 |
 |
|
While this has not always
been the case, timelines are now at the center of most performance work we
undertake today within OpenVMS Engineering.
This applies to our internal efforts as well as our many interactions with
customers and partners. These include:
- Tuning
- Stress testing
- Benchmarking runs
- System sizing estimates
- Checking for unexpected side effects
- Spare capacity evaluation and estimation
- Troubleshooting and bottleneck identification
- Dealing with reported cases of performance anomalies
- Validating that recommended changes really made a difference
- Estimating the headroom added by the newest models of hardware
- Characterizing the relative performance behavior of new versions of software
|
Timeline Charts Have Explanatory Power. |
 |
 |
|
One of the most important
ways that a timeline-driven approach improves any performance project is that
timeline data are naturally and inherently graphical. It is always possible to make your performance findings visible
to yourself (for analysis). It then
becomes possible, post-analysis, to select a small set of key visual outputs
and craft a visual performance
explanation to share with others.
This is especially powerful when the analyst can sit side-by-side with
one or more interested parties and explain a carefully selected visual timeline
while pointing to the natural features of the graphic and interacting with the
other viewers. The interested parties
in these cases could just as easily be technical or non-technical, because visual
explanation has been proven to work well with both audiences.
NOTE
The graphs shown in the
examples and the conclusions presented as to what they mean come from a
thorough analysis of a much larger set of data and the observation of the
timeline behavior of many many variables.
The charts shown and the conclusions don't stand on their own. We fully expect that different analysts
looking at the same timeline data might come to a somewhat different set of
conclusions. The beauty of the approach presented in this document is that the
timeline data so gathered and saved in timeline history data banks is readily
reusable and is intended for collaborative use. It serves as the core reference point on which to build, discuss,
and defend a set of hypotheses that help explain the patterns observed in the
data. Our assumption is that that we
always save the underlying core timeline data so we can return to it in case
any question arises or if we decide to re-analyze the situation based on new
information that has come our way.
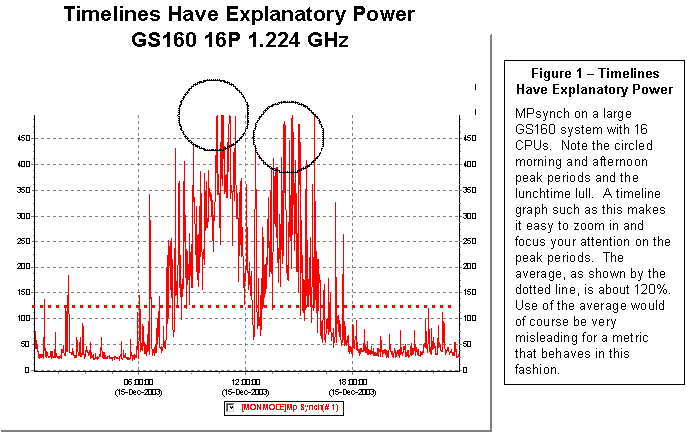
Figure 1 gives a simple
example of the potential explanatory power of timeline graphics.
|
Timelines Are Everywhere. Timelines Are Us. Timelines Foster Collaboration. |
 |
 |
|
Almost every stakeholder (and
everyone we might need to communicate with) is already familiar and can easily
grasp timeline graphics. Most of us
have already seen innumerable stock market price charts and other examples of
timeline graphics. Visual timeline
processing is a powerful built-in human skill that requires virtually no
training to tap.
Within OpenVMS Engineering,
we have time and again found that the more we use timelines for our performance
work, the better, faster, and easier it becomes for us and for everyone else
involved to understand a given performance issue.
|
Timelines Are Old Hat, But |
 |
 |
|
Of course, the importance of
timelines and their central role in conducting effective system performance
work has been known for many years.
It's nothing new.
The reasons for widespread
timeline use are far ranging: Real
systems are complex. The workload mix on live production systems can change
radically in the course of a few minutes.
Here are a few questions, answers, and example graphics to clarify this
point.
QUESTION: How can you identify when those changes occur
or which mix is in play when a bottleneck appears?
ANSWER: Timelines graphics can help bring this story and the
necessary distinctions into sharp focus.
Figure 2 gives a simple example how a
timeline graph can reveal changes in mix.
QUESTION: Resource bottlenecks may last only for a few minutes
at a time. How can you find those periods and zoom in for further
analysis? How will you know which
resources are most related to system slowdowns?
ANSWER: Timelines literally let you see when the peak periods
begin and end for every measured resource.
By comparing those peaks for the resource to the periods when slowdowns
were noticed, you can detect whether there is a plausible relationship between
the observed peak and the slowdown.
Figure 3 shows both the way in which the
graphics reveal trends in the data and the specific way you can use a graph to
identify the most important periods for further, detailed inspection. Identifying the peak period is essential if
we want to avoid the danger of being misled by average values.
Other types of charts can be
constructed using timeline data as a base.
Scatter plots sometimes prove invaluable for highlighting patterns that
may not be obvious from the time series view.
Figure 4 is a simple example of the ways in which scatter plots
sometimes bring hidden patterns into view.
QUESTION: Something that improves performance for one class of
users may have the side effect of hurting another class of users. How can you clearly see both sides of the story?
ANSWER: Multi-dimensional timelines can often help bring this
picture of side effects into clear focus.
Figure 5 above draws from the same data as the previous examples and
shows that Timer Queue Entry (TQE) activities appear to slow down as the total
system load increases.
Figure 6 shows the scatter plot of for TQE under the
influence of rising CPU busy. In this
case, we see both a reduction in TQE activity and a non-linearity in the shape
of the curve.
|
Seven Limiting Factors |
 |
 |
|
Historically, as OpenVMS has
evolved over the past twenty-five+ years, many expert performance analysts have
used timeline-driven approaches with excellent effect. A number of tools and capabilities have
grown up to help support this work.
Some analysts have made fine use of the timeline capabilities that are
built into existing tools. Others have
harvested timeline data in their own unique ways and rolled their own
downstream tools for manipulating, graphing and reporting with good results.
While there is nothing new in
saying that timelines are essential to success, in OpenVMS Engineering, we
found that our desire to conduct timeline-driven, collaborative performance
work with our customers was impeded by seven key factors.
Factor 1. There
was substantial risk that vital timeline performance data would not
automatically be collected on customer systems before a performance issue
arose. Collection would start only after
some problem or issue appeared and the time to solution was systematically
delayed.
Factor 2. The
best of the existing tools for timeline capture, analysis, and reporting were
frequently unavailable on the system in question or for use by those who most
needed them.
Factor 3. Where the timeline tools were available and
where timeline histories were captured, it was still common to discover severe
productivity limits and a high time cost of using these expert tools
effectively. In these cases, there was
much we might have done for analysis or reporting that was left undone or
incomplete due to real world time and cost constraints on these activities.
Factor 4. There
was a substantial startup cost to learn to take advantage of the complexity of
the best of the existing timeline tools.
Effective use for analysis and reporting typically required achieving a
rather high level of expertise. For
many systems that had the tools, their local ability to do first level analysis
was severely impeded by these expertise constraints.
Factor 5. To
a large degree, the best of the existing tools imposed limitations on analysis
and reporting to those fixed and unchanging capabilities that had been designed
into the tools in the first place. Only
those willing and able to program new capabilities on top of the existing set
were able to invent new approaches.
Factor 6. The
data created from one set of collectors did not play well with data from other
important collectors. This
incompatibility substantially limited sharing of data and extendibility of
methods.
Factor 7. There
appeared to be several ways in which the existing timeline tool set was still
wed to 1980's technologies and mindset.
The 1980's was a period when memory, disk, and CPU power was rather more
scarce and expensive than today. It was
also a time when human expertise was both more abundant and less costly.
|
Abundance & Scarcity. Computing Power is Abundant. Time is Scarce. |
 |
 |
|
We noted especially how
existing built-in and handcrafted timeline capabilities failed to take full
advantage of the current abundant desktop and mobile computing power. In our new century, it is nearly universally
true that desktop and laptop personal computing power is overflowing. Meanwhile, the scarcest resource for
performance analyst work today always seems to be the analyst's personal time.
System managers and performance engineers have less time to handle more
complexity on an ever-increasing number of systems.
|
Improving Our Timeline-Driven Work. Improving How We Use Our Own Personal Time. |
 |
 |
|
Over the past three years,
OpenVMS Engineering has been looking for new and improved ways to make
timelines even more useful in our own performance work. We were especially interested in the idea of
being able to use any new approaches wherever and whenever we needed them on
all customer and all internal OpenVMS systems.
We needed universal tools and methods.
We also had a keen interest
for developing new approaches that would make our work more and more
productive, that would take full advantage of the abundance of desktop
computing power, and that would compensate as best as possible for the scarcity
of our own time. Consequently, we have
developed and evolved our timeline-driven approaches with these two
simultaneous goals in mind:
1. Be highly sensitive to questions of an analyst's use
of their scarce time.
2. Freely use abundant resources to save time.
Not wanting to re-invent the
wheel, we have also kept our eyes open for other universal timeline tools and
techniques that might work cooperatively and collaboratively together and that
also kept the scarcity of analyst time clearly in mind. The T4 & Friends path we have taken
stands squarely on the shoulders of those who have come before.
|
If a Tree Falls in the Forest � |
 |
 |
|
Just as there are many
different types of trees in a mature forest, important timeline data of many
different kinds exist for the taking on all systems. It is the raw material needed to carry out any performance
assignment. Response time and
throughput metrics for essential business transactions represent an especially
important type of data that's potentially collectable. When this kind of data
is available, it almost always plays a fundamental and primary role in any
performance work that follows.
Missing Data
Unfortunately, the natural
state of affairs is that response data and other key timeline data that can
help you most with your performance concerns is available only for a fleeting
instant. Some of the most vital classes of data are never even collected. In many cases, crucial events transpire and
essential information about those events is not even counted.
Private Formats
In other cases, timeline data
is saved and stored in some complex internal or private format and then
accessible only in a restrictive fashion using a non-extendable and often
time-consuming set of methods. For
example, MONITOR is a great tool for capturing a wide swath of important
timeline data and saving it in its own internal format as a MONITOR.DAT
file. Unfortunately, MONITOR's built-in
tools for downstream processing of the timeline patterns captured in these DAT
files are limited.
Over Reliance on Averages
Another
problem can arise even when the timeline
data is dutifully collected. If the
only use of the data is to roll it into long-term averages, the underlying
time-dependent complexity will be hidden forever. These averages or the total counts since the system was last
booted may be readily available, but how that important quantity changed over
time is lost. Without detailed timeline
data taken at an appropriate resolution, you will never know when peaks or valleys
occurred, how long they lasted, how high they reached or how low they fell, or
how steady or erratic the overall behavior has been. And you will never be able to examine which factors moved
together during the peaks - a known key to unraveling and revealing possible
cause and effect relationships.
The Incredible Disappearing Timeline
We commonly see many
collector tools that capture essential timeline data, display it to a screen in
text format, or sometimes even use a striking graphical format, and then
destroy earlier timeline data as each new sample arrives. It's what I call "The Incredible
Disappearing Timeline." This screen
data can be exceedingly handy for anyone who is watching in real time. However, a few seconds or a few minutes
later that screen data is lost forever.
Perhaps some key facts are gleaned and remembered by those individuals
who are watching intensely, or a screen print is captured of a particularly
revealing sample. Sadly, if you walk
away and something important happens, you will simply miss it. Worse, even when we literally tie ourselves
to the console, we can monitor only a small number of items at a time -
typically between about 3 and 7 items for ordinary mortals. If something interesting happens in a vital
statistic we are not fortunate enough to be watching (it could even be on the
screen), we are simply out of luck.
Some clumsy workarounds to this problem do exist. For example, you might automatically
write/log the scrolled screen display to an output text file. Later on, you can review that text
output. If you find yourself doing this
all the time, you will likely be tempted to write a program that parses the
text and extracts the timeline information you need.
This default state of affairs
for carrying on a timeline-driven approach to performance work leaves a lot to
be desired. There is a timeline
analogue to the question:
"If a tree falls in the
forest and no one is there to hear it, does it make a sound?"
QUESTION: If vital timeline data from many different
independent and important sources is ready for harvesting, and no one is there
to catch any of it and save it, can this data ever help you at all in your
performance work?"
ANSWER: Maybe the
timeline data for each source makes a sound when it falls uncaught, but no one
will ever hear of it again.
|
Timeline Data is the Raw Material for All Complex Performance Work. |
 |
 |
|
Unless key timeline data is
captured at appropriately detailed resolution, time-stamped, archived for
historical reference, and converted to a publicly reusable format, it is likely
to be lost forever, subsumed into long term (and often misleading) averages, or
only available for experts through rigid, time-consuming, non-extendable
interfaces, or clumsy, time-consuming workarounds.
Half of the work with T4
& Friends has centered on solving this set of problems - capturing the raw
timeline data and saving it in a readily reusable, sharable format so it's
latent potential would be available when needed.
|
 |
|
 |
 |
T4 (originally an acronym for
Tom's Terrific Timeline Tool) is the name given to an
internally developed OpenVMS performance tool.
The original T4V1, written in DCL, was an automated extractor of the latent timeline data previously hidden within
MONITOR.DAT files.
T4V1 converted MONITOR's
natural timeline data for about thirty key statistics into a two-dimensional
timeline table. Each row represented
exactly one sampling period and each column represented exactly one of the key
statistics.
The original T4V1 capability
then saved the two-dimensional timeline data in a readily reusable Comma
Separated Value (CSV) file. In CSV
format, the resulting file was then suitable for further analysis and graphing
with tools such as Microsoft® Excel (one of the first universally available
downstream "Friends of T4").
In what follows, we will
refer to the CSV files created by T4 collection as TLC (Time Line Collaboration) format files. Collectors other than T4 can readily create
timeline files in TLC-format. Then
they can also benefit from the full range of available downstream timeline
tools that have been designed to extract the maximum value from this very
special kind of data.
While what we accomplished
with T4V1 and our first use of TLC-format files may sound somewhat simplistic,
it nevertheless produced a surprisingly large order of magnitude productivity
gain for our performance work within OpenVMS Engineering. Our first use was with some collaborative
customer benchmark tests we were conducting.
We were comparing the performance of the GS140 to the GS160 on a complex
workload that simulated actual load variations and that exhibited intricate
time-dependent behavior.
We wanted to compare relative
performance of the two systems during relatively short-lived peak periods. We had discovered that the averages over the
entire test did not adequately explain the behavior during these peak
periods. We knew we had to examine the
time-series behavior to fully understand what was happening.
The original T4V1 automated what
had been a clumsy and time-consuming manual process. We had previously been forced to use this expensive manual
approach to visualize the relationships in time-dependent changes among the
most important OpenVMS variables.
Unfortunately, because of time constraints, there were many important
cases where we did not have the luxury to carry out these expensive manual
steps regardless of how much they might have helped.
Because any OpenVMS system could record and save periodic sample data in
MONITOR.DAT files, once we had the original T4V1 extractor, we could turn that
MONITOR data into a universal TLC-format that permitted ready and rapid
visualization of that system's time series behavior. Every OpenVMS system could now create timeline data in a
universally re-usable format with a relatively modest effort - a big step
forward for us.
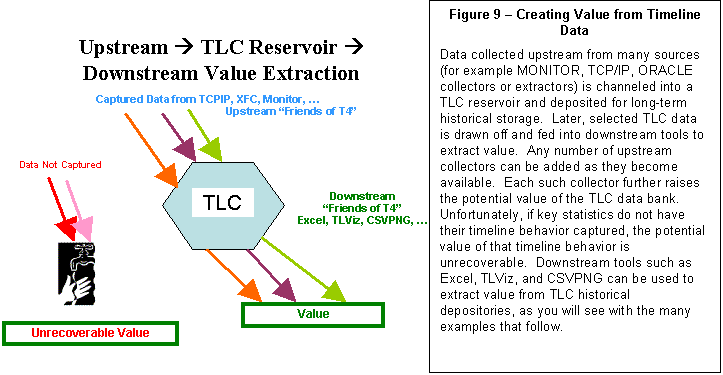
We fed TimeLine Collaboration
(TLC) format CSV data from MONITOR into Excel.
Then, we were able to use Excel's graphing capabilities to examine the
time-varying nature of thirty important OpenVMS system performance
variables. We had pre-selected these 30
variables for a proof-of-concept trial of the T4 and TLC approach.
|
 |
More Than Just MONITOR Data. Timelines Work With Business Data. |
 |
 |
|
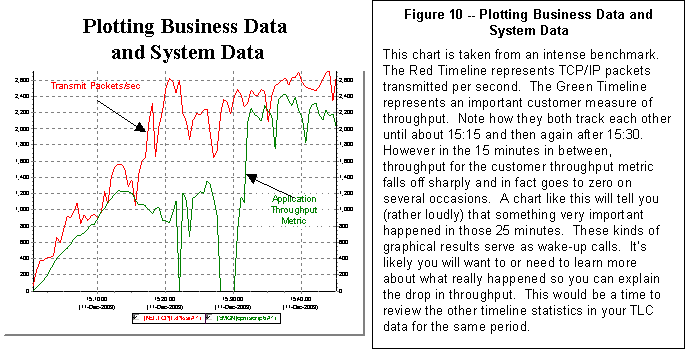
On this same benchmark, we
used a combination of DCL, the OpenVMS SEARCH utility, and a customer utility
that reported on cumulative application performance and rigged a rudimentary
way to capture and save timeline results for customer response time and throughput
of key transactions - these were the vital business statistics that the
customer was using to evaluate the results of this benchmark project.
By putting these two streams
of timeline data together into a single spreadsheet and graphing the
relationships between response, throughput, and key system variables, we were
able to complete a thorough analysis of the benchmark and its peak period
behavior that otherwise would have been unachievable. Figure 10 gives an example of how bringing business and system
data together adds to our understanding.
Since that first benchmark
and proof-of-concept of T4 and TLC, a lot has happened. What we are now calling
"T4 & Friends" has taken on a central role in OpenVMS Engineering's
performance work - especially our collaborative efforts with OpenVMS customers
and partners. This has been especially
so when dealing with complex, live, mission-critical production workloads on
the largest OpenVMS systems. T4 and
Friends includes the many subsequent improvements, extensions and elaborations
to the original timeline data extractor and collectors combined with a growing
set of downstream capabilities for extracting even more value from the
universal TimeLine Collaboration (TLC) files so created.
T4 & Friends today
includes many different synchronized collection utilities gathering literally
hundreds of columns of important performance data and saving it in a universal TLC-format. T4 & Friends also includes a growing
list of capabilities and methods for manipulating, analyzing, learning about,
charting and reporting on TLC data contained in ready-to-use CSV files.
With the successful use in
this first benchmark project, the Original T4 and the subsequent post-processing
with Excel was added as a standard part of our OpenVMS Engineering performance
tool kit and found wider and wider use as time went on.
The ability to turn important
OpenVMS MONITOR performance data from any OpenVMS system into a visual timeline
graphic was one of the key driving forces in the early development of the Original
T4.
We have traveled far since
these early steps with T4 including the development of highly automated and
time-saving approaches for comparing two sets of data in a series of single Before-and-After
graphs. Figure 11 is an example of one
such chart. We will return to this idea
later in more detail, for example in Figures 25 and 26.
|
What is in the T4 Tool Kit? |
 |
 |
|
The original T4 extractor has
since evolved into version T4V32 and version T4V33 kits. Each kit consists of collectors, extractors,
synchronizers and other capabilities.
We'll use "T4" or "T4V3x" or "The T4 Kit" to refer collectively to these
current versions.
The T4 Kit has now become a
mainstay of all OpenVMS Engineering performance work. This includes widespread use as part of collaborative projects
with customers and partners on their most important systems. Most recently, the T4 kit proved to be an
essential data gathering arm that fed the success of the GS1280 Performance
Proof Point (P3) Project (as presented in the November 2003 ENCOMPASS webcast).
|
Six Collectors - More than a Dozen Views |
 |
 |
|
Over the past three years, T4
has evolved and improved so that it now draws data from six different independent sources and literally hundreds of
variables, giving us a more complete view of the underlying performance drivers
that can impact OpenVMS systems. Each
collection source produces its own two-dimensional TLC-format table as output. The six collectors offer more than a dozen
separate views of data, each view with its own unique set of individual
metrics.
Other enhancements in the T4
kit include automation of historical archiving, automated integration and
synchronization of the separate TLC-format CSV files, DCL-driven control
programs suitable to individual customization, and the optional ability to Zip
and mail resulting TLC data. These
added features have continued to make the T4 kit an ever more useful
productivity enhancer and time saver for anyone interested in OpenVMS
performance.
Because of the
straightforward structure of the DCL code for launching and managing six
collectors, new collectors can be added and synchronized quite readily as they
become available.
|
Accessing the T4 Kit. |
 |
 |
|
The
T4V32 kit is now publicly available for download from the web at
» http://h71000.www7.hp.com/OpenVMS/products/t4/index.html
The T4V33 kit is now shipping
automatically in the SYS$ETC directory
in OpenVMS Alpha Version 7.3-2. Both
T4V32 and T4V33 are suitable for AlphaServer systems running Version 7.2-2 or
higher.
For
earlier versions on Alpha and for use on VAX, the T4V2A version (written in
DCL) is available from the OpenVMS freeware CD at:
» ftp://ftp.hp.com/pub/openvms/freeware40.zip (594MB) look in the T4 directory
Versions of T4 collection
will also be provided for use on HP OpenVMS Industry Standard 64 Evaluation
Release Version 8.1 for Integrity Servers.
System Health Check (SHC) has
added T4-based timeline collection, analysis and reporting to its extensive
list of OpenVMS capabilities. SHC is offered by HP Services' Mission Critical
and Proactive Services and is widely used on customer OpenVMS systems with Gold
and Platinum Support.
The latest SHC version for
OpenVMS includes new performance rules based on the TLC data captured by
T4. SHC is a suite of assessment tools
and services that provide a thorough, broad assessment of customers' computing
environment by identifying security, performance, configuration and
availability problems before they can impact the customers' critical
operations. SHC assessments are
executed against sets of best practice system management rules.
Those
OpenVMS AlphaServer customers already signed on to the SHC service have the
option of using the embedded T4 kit to turn on historical timeline data
collection and archiving on their systems.
For more information on SHC check out:
|
Increasing T4 Kit Use on Production OpenVMS Systems |
 |
 |
|
With this widening public
availability, many OpenVMS customers and partners have taken the T4 kit and
begun applying it. Some are using it
with default settings to create performance histories for their most important
OpenVMS nodes. Others are taking
advantage of the kit's natural extendibility and have been customizing it for
their own use with excellent personal results.
We are starting to receive feedback outlining some of our customers'
most useful extension ideas. We plan to
consider these for possible inclusion in future versions of the standard T4
collection and historical archiving kit.
|
Collect First, Ask Questions Later. |
 |
 |
|
There's the old saying from
Western Cowboy movies about "'shooting first and asking questions later." We feel the same way about collecting and
saving timeline data, about turning on timeline history creation now and
deciding later how best to use it, and about how best to leverage the TLC (TimeLine Collaboration) format data so
collected.
|
Don't Delay. |
 |
 |
|
There are many ways one might
create readily reusable TLC historical data for your OpenVMS systems. Pick the one that works best for you.
Whatever you decide, we strongly suggest you don't delay in beginning a TLC
collection process. For a wide variety
of OpenVMS system statistics, the T4 kit is readily available for this purpose
and we suggest you consider it as one of your options to get a quick
start.
We recommend you collect and
save TLC data even if you are not going to look at the data right away or
anytime soon, or even if you don't know yet what you want to look for.
We recommend you collect TLC
data even if you don't yet have the ideal downstream tools you have dreamed of
to post-process this data into graphs and charts and squeeze the maximum value
out of it.
We recommend you collect TLC
data even if you don't have anyone locally available who is a whiz at Excel or
at SQL queries or at writing your own special new utilities that extract value
from TLC data by building on top of existing graphical or statistical packages.
|
Business Statistics Deserve the Very Best Treatment. |
 |
 |
|
We recommend that you also
begin to build TLC collectors or extractors for your most important business
metrics and add these into the historical mix.
In many cases, these statistics are the ones that are most important to
your success. They deserve the very
best treatment.
Like other statistics, the
timeline behavior of essential business statistics will change over time, will
show peaks and valleys and perhaps sudden dramatic changes, repeated cyclical
patterns, or unusual erratic behavior.
If you are not already
capturing this timeline behavior for your business metrics, the value you might
have extracted is unrecoverable. We
suggest you find a way to get some kind of timeline capture turned on as soon
as is practical for you. Building your
own collector that directly generates TLC data would be the most desirable
choice if it turns out to be at all possible.
You may already be capturing
timeline business data and saving it in a non TLC-format. If, however, this vital data has for all
practical purposes proven inaccessible to you due to time, money, complexity,
access, or expertise, we suggest you consider finding a way to extract a TLC
version of that data and integrate it with our other key TLC metrics.
|
Compatible Use of TLC with Other Timeline Utilities |
 |
 |
|
Some of you may already be
collecting timeline history in non-TLC-formats using other OpenVMS utilities.
This is great. Don't stop. Continue to use these tools and the timeline
data they provide to extract value that benefits your systems.
In addition, please note,
that a substantial number of customers and partners are already successfully
creating TLC data (using the low-overhead, non-disruptive T4 kit) on systems
that are running other performance timeline collection software. The T4 kit's low overhead at its default
setting of 60-second sampling means that you can use it virtually anywhere,
including in conjunction with these other performance tools.
Once you turn on TLC
collection on your most important systems, we believe you will discover that
the TLC approach based on T4 & Friends offers you capabilities that enhance
and extend any you may already be using - especially in the areas of saving
your precious time and letting you look at some key performance variables not
otherwise available.
We would enjoy learning about
your experiences and impressions as you follow up on some of these ideas. You are welcome to forward your thoughts on
TimeLine Collaboration to the author.
|
An Automatic Payoff of Substantial Size |
 |
 |
|
 Once you
begin creating TLC histories, you dramatically change your ability to
collaborate with and communicate with OpenVMS Engineering and with OpenVMS
Ambassadors about the performance issues that are most important to you. While there are some other wonderful
performance tools out there, within OpenVMS engineering we have radically
diminished their use. Wherever possible,
we have switched to TLC based on T4 & Friends for our collaborative efforts
with customers and partners. Once you
begin creating TLC histories, you dramatically change your ability to
collaborate with and communicate with OpenVMS Engineering and with OpenVMS
Ambassadors about the performance issues that are most important to you. While there are some other wonderful
performance tools out there, within OpenVMS engineering we have radically
diminished their use. Wherever possible,
we have switched to TLC based on T4 & Friends for our collaborative efforts
with customers and partners.
The main reasons are the ease
of T4 collection, the increasing number of new upstream collectors that extend
our view, and the growing power of the downstream Friends of T4. Together, this combination helps us generate
more and better TLC data and extract more value from the accumulating reservoir
of results. We have found this approach
to be an order of magnitude more efficient for us in our personal time
use. We think you will find similar
savings to be true for you once you get started.
The TLC-based model is
open-ended and readily extendable, as you will learn below. This will simplify synchronization with your
most important business data and with data from other collectors and
extractors.
For all these reasons, when
it comes to timeline data we recommend that you "Collect first and ask
questions later". You won't be
sorry.
|
Two-Dimensional TimeLine Collaboration Tables |
 |
 |
|
TLC-format data is simply a
two-dimensional table of timeline data saved in CSV (Comma Separated Value)
format. These files obey a few basic
rules. By convention, each row
represents exactly one time
interval; each column represents exactly
one important performance variable. The first column, known as "Sample Time",
contains the date and time at the end of each interval. Think of these files as being in TLC Normal Form (TNF)
|
|
 |
For
historical reasons, many TLC-format files have a total of four header lines
with the important fourth line being the column header. In these files, the first line contains
comment information in a CSV format.
The second line contains only the calendar date at the start of
sampling. The third line contains only
the time of day for the first sample.
Future versions may loosen these rules about headers and make them more
universal - in particular by making the second and third lines optional. If you are going to create new TLC-format
files, consider sticking with the original T4-style format for now, as all of
the downstream friends of TLC-format data are then fully available to you.
|
Sample Time
|
Variable 1
|
Variable 2
|
Variable 3
|
Variable 4
|
�
|
|
10:21
|
37
|
58
|
107
|
19
|
|
|
10:22
|
44
|
51
|
128
|
12
|
|
|
10:23
|
29
|
74
|
103
|
25
|
|
TLC Normal Form (TNF) - A fragment of a TLC-format
two-dimensional table
|
A Standard, Widely Accepted, Universal Output Format |
 |
 |
|
The widely used CSV file
format is the current output standard for TLC-format two-dimensional
tables. What this means is that a wide
range of existing tools ranging from spreadsheets to databases have built-in capabilities for reading TLC-format
files automatically. This opens the
door for the full power of these already available tools to be applied to any TLC-format
data. This can be extremely handy if
you or someone on your team happens to be a whiz with Excel or an SQL
giant.
Conversion to or from other
useful two-dimensional timeline formats is also readily possible with minimal
programming. The two-dimensional
underlying format is a completely universal way to represent any and all timeline
data from any source.
|
Open-Ended, Synchronizable Data |
 |
 |
|
 The standard
CSV format means that data from other important timeline sources can be
integrated and synchronized whenever it becomes available. By definition, each TLC-format CSV file
contains internal timestamps that allow the possibility for later synchronizing
timeline data from multiple independent sources. The standard
CSV format means that data from other important timeline sources can be
integrated and synchronized whenever it becomes available. By definition, each TLC-format CSV file
contains internal timestamps that allow the possibility for later synchronizing
timeline data from multiple independent sources.
Our experience within OpenVMS
Engineering tells us that synchronization is especially helpful in making sense
of the most complex performance situations. The current T4V32 and T4V33 kits
contain a utility (APRC - APpend ReCord) and the DCL code to drive it that
automatically combines the timeline data from the current set of six
independent timeline collectors in the kit while carrying out some rudimentary
synchronization steps.
|
Readily Programmable Data |
 |
 |
|
The easy to read and
understand CSV format also means that new tools can be written that load the TLC-format
data into memory with zero or minimal programming. Then, precious programming time can be employed in carving out
new capabilities and methods. These
could cover the range of examining, manipulating, graphing, analyzing, or
reporting on the timeline data.
Ready programmability is not
a theoretical property of TLC. Our
experience in OpenVMS Engineering and in HP Services over the past three years
has yielded impressive results with the creation of tools such as TLViz and
CSVPNG and other downstream Friends of T4 as we will learn below.
|
A Universal Approach |
 |
 |
|
By obvious convention, the T4
kit turns all of its timeline data into TLC-format CSV files. The good news is that it is possible and not
difficult for any collector of
timeline data to automatically create T4-style or TLC-format output on the fly
as each timeline sample is captured. For example, four of the six current
collectors directly generate their timeline output in CSV format.
This is, as they say, an SMP
problem: a Simple Matter of Programming (or perhaps a Simple Matter of
Priorities).
Alternatively, timeline data
in any other internal format can
(without huge difficulty) be extracted and converted into TLC-format - another "SMP"
problem. The T4 kit includes an
extractor that creates timeline columns for logins and logouts. This extractor
uses the log data time-stamped in the standard OpenVMS Accounting Log File,
searching that file for logins and logouts, accumulating the numbers for each
sample period, and then writing the records to the CSV file row by row. This extractor is quite interesting in that
it also adds some extra value on the way out by counting the number of logins
and logouts of short duration, for example those less than 1 minute in length
and those less than 5 minutes in length.
The kind of approach we used
with the OpenVMS Accounting Log is readily replicatable to other log
files. It could be applied to a whole
raft of other collection utilities to extract selected variables not otherwise
available and to turn their timeline data into the universal TLC-format.
|
Follow-up Questions for Timeline Data in Log files |
 |
 |
|
The
questions below may help you identify some opportunity areas to extract vital log
file data that is not readily available to you today.
Question 1. What vital timeline data relevant to the mission
critical purposes of your OpenVMS systems is currently locked inside some log
file to which you have potential access?
Question 2. What
is the internal format of that log file?
Question 3: What
would be the estimated cost to build an extractor that grabbed key statistics
from that file and turned them into TLC-format data?
|
Timeline Data in Text Files |
 |
 |
|
Another possibility, albeit a
somewhat clumsy one, is to capture timeline data as a series of repeated
time-stamped entries in a text file and then later automate the parsing and
processing of that file to turn key metrics into CSV format. This is important if there are impediments
to working directly on the collector program to have it write out the TLC-format
CSV file itself. We have done this
quite successfully with a number of prototype collectors to capture some vital
stats that would otherwise not have been easily available to us in timeline
format. While messy, this kind of
collector can be readily and speedily constructed whenever needed at modest
cost.
|
Follow-up Questions for Timeline Data in Text Files |
 |
 |
|
The
questions below may help you identify some opportunity areas for you to first
create and then extract vital data from text files where such data is not
readily available to you today in a reusable format.
Question 1. What
statistics that are vital to the operation of your OpenVMS systems might you
capture as time-stamped entries in a text file? For example, you might do this using a DCL script with a timer
loop and an embedded call on an application command that gives total throughput
counts for key functions.
Question 2. What's
the estimated cost to you to build a suitable extractor to parse this text file
and transform the vital statistics into a TLC-format?
Because the TLC-format CSV
files are but one of many possible universal ways to format timeline data, note
that other SMP programs could be readily constructed (as needed) to transform
any TLC-format data into a chosen alternative universal format such as XML or a
set of Oracle, Rdb, or MySQL tables.
|
The Bottom Line for TLC-Format Data is that it is Readily Reusable |
 |
 |
|
TLC-format data can be used
as a universal approach to timeline data.
Any timeline data from any source (including but not limited to any
OpenVMS performance data collector) can be converted to TLC-format data.
Many have already taken up
the call. TLC-format collectors or
extractors have been written for performance data from Oracle, Rdb, and from
customer business statistics such as response time, throughput, internal
application queueing, or even such things as sales volume attained by clerks
using the OpenVMS system. More
collectors and extractors generating TLC-format data are sure to follow as the
universal T4 & Friends timeline-driven approach and its benefits become
more widely known among the OpenVMS community.
The bottom-line payoff from
TLC data is that it is readily reusable in ways that promote
communication and collaboration. This
means that it is:
- Readily programmable for new purposes as they are thought up.
- Readily or even instantly viewable.
- Readily synchronizable with other TLC data sources.
- Readily comparable to other TLC data sets.
- Readily extractable into reduced form.
- Readily sharable.
- Readily publishable in documents, presentations, and to the web.
|
 |
|
 |
 |
As use of the T4 tool kit
proliferated, as more and more TLC-format histories were generated, and as the
range of uses of the T4 tool kit and TimeLine Collaboration (TLC) format
two-dimensional timeline tables widened, it became clear that capabilities
beyond those offered by Excel's processing of CSV files could prove immensely
helpful. Within OpenVMS Engineering, we
discovered quite quickly that not everyone who wanted to use a timeline-driven
approach was comfortable with using Excel as his or her main post-processing,
value-extraction engine.
With more and more valuable
timeline data beckoning, a growing number of other tools, methods, techniques,
and approaches have evolved and have proven successful in helping OpenVMS
Engineering enhance our timeline-driven approach to performance. We have come a long way from the Original
T4.
Here's an abbreviated summary
of current capabilities (as of early 2004) to give you a taste for ways in
which T4 & Friends might prove directly useful to you.
|
 |
The T4 Tool Kit (T4V32 and T4V33) |
 |
 |
|
The T4V32 and T4V33 tool kits
are a good place to start your exploration of T4 & Friends. See the Readme.txt file in the kit for full
details. These kits include scripts that
automate historical timeline collection using six separate collectors or extractors,
as well as utilities for synchronization, mail distribution, and near real-time
snapshots.
You can examine the
Readme.Txt file and download the T4V32 tool kit from http://h71000.www7.hp.com/OpenVMS/products/t4/index.html
The T4V33 tool kit is now
shipping with the release of OpenVMS Alpha Version 7.3-2. You can find the kit in the SYS$ETC
directory.
T4V3x collection can be a
useful adjunct to your existing performance management program, and it
co-exists peacefully and with low overhead with all other major OpenVMS
performance data collectors. Whatever
performance collectors you depend on today, we recommend that you also consider
turning on low overhead T4 history creation.
Creation of such a TLC
history will automatically open the way for your improved collaboration with
OpenVMS Engineering in the future, whenever this might be valuable, useful, or
even necessary for you. Of course, as
you learn more about T4 & Friends, you will also find that your growing T4
timeline history (building automatically day by day) will powerfully extend
your ability to manage performance on your most important systems and
complement your existing performance capabilities and tools.
The T4V3x kit includes the
T4EXTR.EXE utility - a classic example of a timeline extractor. T4EXTR converts the raw MONITOR.DAT files to
CSV format and generates literally hundreds of columns of data. T4EXTR can be used manually as needed to
re-examine the same raw MONITOR data and extract additional and more detailed
columns of data. For example you can
use it manually to find out about specific named process use or about RMS use
for files for which you have turned on RMS monitoring. This utility includes several options for
customizing and selecting which columns you wish to generate (ALL, CPU, DISK,
PROCESS, SCS, RMS).
Two DCL scripts,T4$CONFIG and
T4$COLLECT (called "HP_T4_V32" in the T4V32 kit), map a default approach for
collecting data every day and transforming it into TLC-format CSV history
files. Because these are written in
straightforward DCL, many T4 Kit users have already found these scripts to be
readily customizable for specific local purposes. These scripts allow you to automatically launch all current
collectors and then to combine data from the different collectors into
composite CSV files.
These scripts provide low
overhead monitoring by using a default 60-second sampling interval. They also
include a rough automatic synchronization of data from different collectors,
some rudimentary storage management, optional mailing, and, most importantly,
the automatic creation of a detailed long-term timeline history for that
OpenVMS node in TLC-format.
The current list of collectors/extractors in the kit
includes:
- MONITOR (T4EXTR)
- XFC
- Dedicated lock manager
- TCP/IP system wide traffic
- Network adapters traffic (you can request one collector for each such adapter)
- Login and logout activity (using the standard accounting log and an associated extractor)
The combination of MONITOR
and T4EXTR alone deliver more than a dozen different views of OpenVMS
performance, each view with many independent statistics. For example, the SYSTEM View includes
such statistics as CPU IDLE, MPSYNCH, KERNEL, BUFFERED IO; and the LOCKING
View includes such statistics as CONVERTS and ENQUEUES.
|
Customizing the T4 Tool Kit Scripts |
 |
 |
|
As you look at the T4 kit's
two controlling DCL scripts and the ways in which each new collector is
included, you will likely conclude that adding your own new collector (for
example, one for your most important business statistics) will be a relatively
straightforward extension whenever you are ready to do so. You won't be sorry if you consider making
some investment in understanding the capabilities of these two DCL scripts.
|
Industry Standard or Other Widely Available Friends of TLC-format Data |
 |
 |
|
With the Original T4
extractor, we fed its output data in TLC-format CSV files into Excel. Then we tapped Excel's many capabilities for
manipulating the columns of timeline data, for calculating averages and
percentiles, and for creating a virtually infinite variety of individually
customized timeline graphics representing the findings of our analyses. This proved a great advantage to those
experienced with Excel and provided an immediate positive visual payback for
our investment in the MONITOR to TLC extractor program.
Since then, others have taken
TLC data (including, but not limited to T4 captured data) and fed it into a
variety of databases (Microsoft® Access, Oracle 9i, Oracle Rdb, MySQL). They
then used their expertise with those tools to query and report on the growing
storehouse of timeline data.
Others have used OpenVMS
utilities such as FTP, MAIL, COPY, Zip, Unzip, Uuencode and appropriate DCL
wrappers to move their TLC data exactly to where they wanted it for further
processing. TLC-format CSV files
typically benefit from relatively high compression ratios when being zipped for
transfer.
TLC data have been
transformed into WMF (Windows Meta File) graphic files and then imported into
Microsoft® Word or PowerPoint for explaining the results. Various drawing and annotation tools come in
handy in customizing the results. The
illustrations in this article are an example of what you can do with the
additions of arrows, text boxes, or circles.
TLC data has been converted
to PNG (Portable Network Graphics) images and embedded in HTML web pages. Using Apache Web Server, Mozilla and PHP
(all running on OpenVMS), TLC-format graphical outputs can now be published on
demand to the web by those comfortable with OpenVMS' extensive web-based
capabilities.
|
Bottom Line - Readily Reusable |
 |
 |
|
Any TLC-format
CSV file from any source is instantly usable and readily reusable by
widely known, widely available utilities for analysis, reporting, data
transfer, or publishing. TLC tables can
be readily converted to graphic timeline images and the images to industry
standard graphic output formats such as WMF and PNG. These images, in turn, can be incorporated in desktop publishing
documents or even published dynamically to the web. In other words, once key timeline data is converted to the
universal TLC Normal Form (TNF),
everything we can imagine doing with this timeline data is possible and some of
those things are immediately available for the asking.
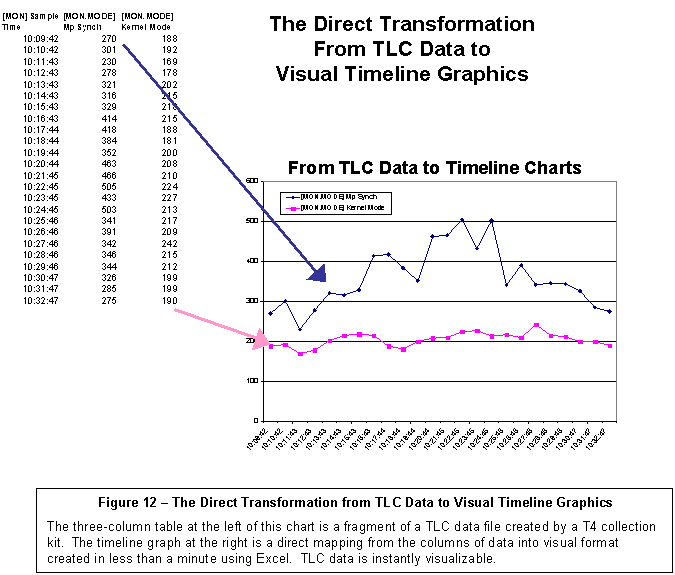
Figure 12 gives a highly
simplified picture of the direct transformation from TLC-format data to visual
image.
|
HP-Developed Downstream Utilities |
 |
 |
|
 The
"upstream" collection of performance timeline data and the filling of a large
reservoir of online storage with TLC history files are, of course, not ends in
themselves. As the reservoir of TLC
data grows, the potential value of
that data bank grows with it. To turn
that potential value into actual value requires selectively drawing off some of
the data and flowing it downstream into mechanisms whose very purpose is to
extract that value. The
"upstream" collection of performance timeline data and the filling of a large
reservoir of online storage with TLC history files are, of course, not ends in
themselves. As the reservoir of TLC
data grows, the potential value of
that data bank grows with it. To turn
that potential value into actual value requires selectively drawing off some of
the data and flowing it downstream into mechanisms whose very purpose is to
extract that value.
Excel was our first such
downstream tool, and its use with TLC data created a powerful proof point. It demonstrated the large potential value of
historical timeline data when saved in a readily reusable format. Since then, HP has undertaken a series of
independent development efforts of downstream utilities to help extract even
more value from performance timeline data saved in TLC-format. These include: extensions to the System
Health Check offering from HP Services, and two other internal use HP utilities.
- A productivity-enhancing, interactive, timeline visualization tool (TLViz).
- A powerful command-line driven tool for manipulating and charting TLC data (CSVPNG).
System Health Check Service. Automated T4 collection is now a standard
part of the improved System Health Check (SHC) service used by many OpenVMS
customers. The new SHC automatically
runs a T4 collection, creates TLC-format CSV files, applies a set of expert
rules, and then reports and graphs the results as part of the overall SHC
output. So if you are already using
SHC, you are already making good use of and benefiting from T4 collection. For more information about SHC, please
contact your local HP Services representative or check out: the following web
site:
» http://www.support.compaq.com/svctools/shc/
TLViz and CSVPNG. TLViz stands for
TimeLine Visualizer, and CSVPNG stands for an automatic CSV to PNG (Portable Network
Graphics) converter. TLViz and CSVPNG
are interesting in their own right as well as being an excellent demonstration
of the wide range of possible value-extracting downstream uses that can be made
of TLC-format data. We have used these
extensively with tremendous effect.
They have dramatically changed the way OpenVMS Engineering does its most
important performance work. These tools
have demonstrated how easy it is to unlock some of the value captured by TLC-format
universal timelines.
|
 |
|
 |
 |
TLViz is an excellent example
of what we mean by a "friend of T4."
TLViz is an internal tool
developed and used by OpenVMS Engineering to simplify and dramatically speed up
the analysis of TLC-format CSV files and to assist the subsequent reporting and
sharing of our findings with others.
The combination of T4
timeline-driven collection and TLViz has literally changed our lives in OpenVMS
Engineering. TLViz is a Microsoft®
Windows PC utility (written in Visual Basic and using TeeChart software as its
graphics engine). TLViz permits the
analyst to carry out the most common graphical functions on these large
timeline data sets with the fewest possible keystrokes when compared with
alternative methods that we have tried.
Within OpenVMS, we estimate that TLViz personally gives us an order of
magnitude speedup and productivity increase in our own analysis work with this
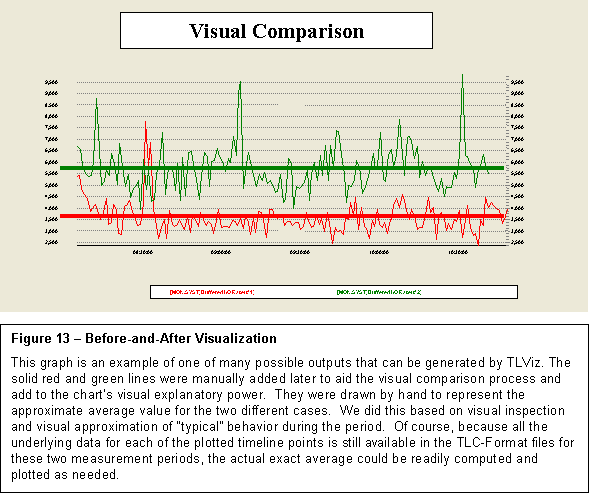
kind of highly multi-dimensional timeline data drawn from multiple sources. Figure 13 is an example of a TLViz output
that tells a powerful before-and-after story.
|
|
 |
When TLViz opens up a TLC-format
CSV file, the names of each performance variable appear in a standard Windows
selection box. The names of the
performance variables are drawn from the column header for each column of
timeline data in the TLC file. By
simply clicking once on the performance variable in which you are interested,
the visual timeline graph for that variable appears immediately in the graphing
window.
With the CTRL-key held down,
you can decide exactly which set of variables to map together. Or you can use the arrow keys to move, one
graph at a time, through the literally hundreds of variables - getting a quick overview
of the underlying patterns - all in a matter of minutes.
TLViz includes features such
as mouse-driven zoom, scrolling, stacking, unstacking, correlating, automatic
scatter plots between pairs of variables, column arithmetic, and saving a
zoomed-in selected set of rows and a subset of the selected columns to a new,
more compact TLC-format CSV file.
|
 |
Reporting with TLViz |
 |
 |
|
Whenever you see a display
you want to save, TLViz lets you add your own title and then export it to a named
WMF file for later use. Consider
creating a special sub-directory for each analysis session where you can
conveniently save the graphs you generate.
This feature has proven to be a powerful memory aid. It is also a wonderful collaboration feature
as these WMF files often form the basis for the creation of reports and
presentations (further downstream) that will share the results of analysis with
a wider audience. TLViz allows several
other output formats for these graphics.
We have found through experience that the WMF outputs work the
best. They offer clean graphics with no
perceptible loss of resolution, they work well with the standard Microsoft
tools such as PowerPoint, and they are relatively well compressed compared to
other formats. Documents and
presentations containing many such graphical elements also tend to show
excellent further compression when these files are zipped for transfer.
|
|
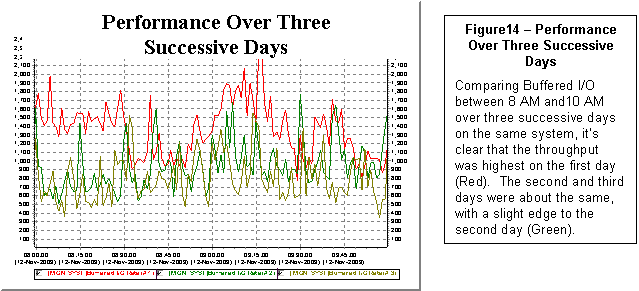 |
TLViz also allows you to open up to five TLC-format
CSV files. It then automatically overlays
the results for you each graph you select.
For example, selecting the column header for Buffered I/O Rate, TLViz
would graph the Buffered I/O Rate timeline for each of the currently open
files. Figure 14 shows a simple example
of this feature.
|
Before-and-After with TLViz |
 |
 |
|
Arguably, the most useful
case we have seen is using TLViz' multiple file open feature to do rapid Before-and-After analysis when the
system under investigation has experienced some form of important change - for
example, a significant slowdown on a live production system. This could also be useful for looking at
upgrades to new versions of software or hardware, for quantifying the benefits
from a series of tuning changes, or for understanding the impact on key
resources caused by the introduction of a new application workload.
T4 collection tools, TLC-format
data and TLViz' Before & After feature, were instrumental in the success of
our GS1280 "Marvel" Performance Proof Point (P3) approach as presented at the
ENCOMPASS webcast in November 2003. We
plan to apply a similar P3 approach (built on T4, TLC, TLViz, CSVPNG and other
friends of T4) to new performance situations.
Performance proof points are popular because they help us all more
clearly understand and more accurately quantify the actual benefits of performance
change. A P3 approach lets us set expectations
more precisely for performance improvements.
We see near term application of the P3 approach as customers with heavy
TCP/IP loads and scaling bottlenecks on large production systems upgrade to
OpenVMS Alpha Version 7.3-2 and TCP/IP Version 5.4 with its new scalable kernel
option.
If you haven't already tried
a visual before-and-after approach to look at differences captured in timeline
data, we cannot recommend it to you too strongly. A very similar Before-and-After approach can be achieved with
CSVPNG, with Excel, or other similar tools.
The key to success is to be careful selecting suitable sample days to be
representative of the before-and-after,
and then looking at many independent graphical comparisons. If something has changed by as much as 5%,
it will show up in the graphs in a way you won't be able to miss.
|
Synergy between T4 Collection, TLC-format Data, and TLViz |
 |
 |
|
As we noted earlier, the
standard format for TLC data includes several header rows. The first such row is reserved for comment
information saved in a CSV format. The
latest T4V3x tool kits make good use of this first row of the TLC table to
store details about the measured OpenVMS system. These include:
- The AlphaServer node name
- The version of OpenVMS in use
- The version of TCP/IP in use
- The number of CPUs
- The amount of memory employed
- The sampling interval used
- The version numbers of the T4 kit components.
TLViz makes these background
details captured at the time of measurement available to the viewer through use
of a "Properties" selection from the "File" pull-down menu.
TLViz' Properties feature
works for any file in TLC-format. So if
you begin to create your own TLC files with your vital business metrics,
remember to put background information relevant to that data in the first row,
so that it will be available for future review. This might include version numbers of key application or database
software or other attributes and properties that are highly specific to your
business environment.
|
Other Uses of TLViz' Multiple File Open Capability |
 |
 |
|
In addition to the powerful before-and-after
visualization, TLViz' multiple file open capability can also be used to compare
and contrast performance as it changes from Monday to Friday. It can also be used to examine the relative
load on different nodes in an OpenVMS cluster for a given day.
|
Side-by-Side Collaboration Using TLViz |
 |
 |
|
TLViz has proven to be a
remarkably powerful tool for side-by-side collaboration. It has allowed us, in selected cases, to
have two or three performance analysts work together analyzing a particularly
complex problem. The GUI interface, the
ability to point to graphical details on the screen, to make suggestions for
adjusting what to look at and then seeing the new picture in a few seconds has
led to some excellent synergistic problem solving.
TLViz has also proven to be a
great way to share results with others quickly without producing a formal
report. The basic model looks like
this. Having previously studied the
situation and noted the important factors, an analyst can use TLViz to project
important graphs one by one to the audience.
Audience questions can trigger the analyst to shift gears and bring up a
graph or a series of graphs that helps answer the question, and then resume
with his or her presentation. When you
are presenting interactively and live to an audience, the ability to point at
features as needed and as driven by the discussion can often add an incredible
benefit beyond what can be pre-packaged in a report that cannot possibly
anticipate every question. Think of it
as a blackboard or whiteboard with built-in automation.
The success of these
collaborative approaches with TLViz has a lot to do with the speed at which new
graphs can be created. TLViz offers a
model GUI design that has transformed the most important activities you might
want to carry out on timeline data and timeline graphs into single keystrokes
or mouse clicks.
|
 |
|
 |
 |
CSVPNG (CSV to HTML and PNG converter) is a
newer, command-line driven utility with many options. CSVPNG runs on both OpenVMS and in DOS on Windows PCs. Like TLViz, it allows you to directly open
one or more TLC-format CSV files. Its
original capability, which led to the CSVPNG name, allows it to open a TLC-format
data file, specify a set of selected columns to be graphed, and then to
automatically generate an HTML page with PNG embedded graphics for each
selected column. Figure 15 is one of
many outputs possible through use of CSVPNG.
CSVPNG includes the following
capabilities:
- Graphing multiple variables in a single chart
- Opening multiple TLC-format files and overlaying the results
- Calculating and displaying moving averages
- Identifying peak periods
- Carrying out correlation calculations
- Performing column arithmetic
- Applying user-written expert rules.
CSVPNG also has powerful
capabilities for "slicing and dicing" a TLC-format data file and producing a
much more compact file as output. For
example, you could use it to select only the data from the peak one hour period
and reduce it further so it outputs only your personal favorite list of 17
performance variables.
Because it is command-line
driven, CSVPNG is programmable and already some have demonstrated how CSVPNG
combined with Apache Web Server, Mozilla, and PHP (all running on OpenVMS)
could dynamically publish T4 timeline graphs from an OpenVMS web-enabled server
node. We have even seen demonstrations
of near real-timegraphical reporting
by combining all these tools.
We expect that CSVPNG will become
much more widely used for our OpenVMS Engineering performance work in the
coming year as we all become more familiar with the full range of its
capabilities and potential for extracting value from TLC data. It's not hard to predict that CSVPNG is likely
to be at the leading edge of our continuing enhancements to the TLC approach in
this coming year.
|
 |
Use of Internally Built Tools Outside of OpenVMS Engineering |
 |
 |
|
TLViz and CSVPNG have
dramatically changed the way OpenVMS Engineering does its most important
performance work as visual diagnostic tools, as visual collaboration tools, as
visual presentation tools, and as incredible productivity enhancers and time savers
during analysis and reporting.
Seeing our success, a number
of customers and partners have made their own business case for gaining access
to these tools and are reporting back to us the productivity gains they have
achieved by using them. If you are
interested in learning more about TLViz or CSVPNG, please send your request for
more information to the author,
.
If you already feel you have
a strong business case for gaining access to either of these internal-to-HP "Friends of T4", please
forward your request to the author.
As an analogue to the saying
"if you build it, they will come", with TLC-format data, we believe that "if
you collect it, they will build." TLViz
and CSVPNG demonstrate that once you place important data in universal, readily
programmable form, it truly is an SMP problem to take the next incremental
steps.
Consequently, we will not be
surprised to see other powerful downstream utilities come into existence over
the coming months to do even more magical things with the rich storehouse of
data now being accumulated.
|
Building Your Own Downstream Tools |
 |
 |
|
TLViz and CSVPNG are powerful
proofs of the concept that the universal data in TLC-format timeline files is
readily programmable in ways that start to squeeze the value from this rich
timeline data source. Many other uses
of this data are possible and potentially even more valuable. We hope some of you will consider
constructing your own downstream tools that extract further value from TLC-format
data and that you will share the results of your success with us.
It's important to note that
both TLViz and CSVPNG did not burst, full-fledged onto the scene. They both started with a basic set of
capabilities and then added new features based on feedback from early users. Both of them built upon existing very
powerful graphical utilities and did not try to duplicate those capabilities
but rather just provided an interface to expose the power of graphing to
everyone without further programming.
Refer to the section
detailing TLC-format data for the definitions you will need to start building
these tools. Further details are
available in the README.TXT file included in the latest T4V3x tool kits.
And while you are thinking
about what tools you can build, don't forget to turn on your TLC timeline
history collection today if you haven't already done so. That way, you'll have the detailed TLC history
data you need once your new tools are ready.
|
Other T4 Style Data Collectors |
 |
 |
|
As we noted earlier, the
current T4V32 or T4V33 umbrella utilities actually drive six independent
collectors or extractors and then later combine, integrate, and synchronize
data from all of them into a single, consolidated TLC-format CSV file with
literally hundreds of individual variables represented. T4V3x automates a consistent start time, end
time, and sampling interval for all six streams of data. We plan to add new standard collectors to
future versions of T4Vxx as these become available.
Even better, anyone with important performance data
can write their own TLC-format collector or extractor and create their own
completely universal TLC-format CSV files in TLC Normal Form (TNF).
The minute that you turn your
key performance data into universal TNF,
all of the old and all of the new and evolving downstream capabilities for manipulating,
analyzing, graphing, and reporting automatically become available to you. For example, you might consider converting
application response time data for key business transactions into a reservoir
of TNF data and then reaping the downstream benefits.
Even better, if you follow
some simple, standard rules for TLC-format collectors (see next section for
details), your newly minted data will line up with and synchronize with and be
combinable with all the data from the standard T4 collection utilities and with
any other collector that also plays by these same rules. We have barely scratched the surface.
|
Synchronization Reveals Relationships that Truly Matter |
 |
 |
|
We simply cannot stress how
important and valuable the synchronization of data from multiple collectors can
be for any type of performance situation with which you will be faced in the
coming year. This is especially true
when business data such as response time or application throughput can be
combined with underlying system statistics, with network statistics, and with
database statistics. The ability to
rapidly identify cause and effect relationships that really matter is increased
many fold. Identification of the most
important time periods to zoom in on is also greatly aided by bringing multiple
views of data into play.
Although the TLC based T4
& Friends approach is relatively new, many important unique collectors have
already been built and integrated with T4V32 data with excellent results by
those who have taken that path. These include:
- Key Oracle statistics from Oracle 7, 8, and 9
- Key Rdb statistics
- Customer application response data
- Customer application throughput data
Several OpenVMS customers
have already created single composite pictures of performance on their most
important mission-critical systems that include their vital response data,
their key database statistics, and the full set of current T4V32 statistics
from its six collectors. They have used
the standard APRC utility included in the T4V3x kit for this purpose.
APRC simplifies combining and
synchronizing data captured from multiple sources and is as readily available
for your specially built collector as it is for the current six standard T4V3x
collectors.
When it comes to TLC-format
collectors, literally anything you can think of is possible. We're hoping to see many such new TLC-format
collectors pressed into useful service and (where possible) shared in the
coming months.
Many important statistics do
not yet have their own, easy to use collector.
Can you help?
|
 |
|
 |
 |
Here are the rules you will
need to follow so that your TLC-format collector will generate data that can be
synchronized with other TLC-format data sources.
Your collector requires four
input parameters:
- Start time
- End time
- Sample interval duration (default for T4V3x is 60 seconds)
- Output file name for TLC-format data in CSV format
No Drift Make sure that your collector's samples do not drift
later and later. This insures that
your collector will have exactly the same number of samples for a given
measurement session as other no-drift TLC
collectors. Unfortunately, some
collectors we have known do in fact drift.
For example, there are some collectors where each sample starts some
given number of seconds (for example 60 seconds after the end of the previous
one). Because it always takes at least
a small amount of time from the beginning to the end of each sample, the next
sample actual completes in the specified number of seconds plus a little more
after the end of previous sample. Over
time, these small delays mount up and drift occurs. While in most cases, you can live with this, drifting makes
synchronization more difficult. For new
collectors, drifting must definitely be avoided for best results. Good News:
The long-standing drift experienced by those using MONITOR has been
eliminated with OpenVMS Version 8.1.
Those running OpenVMS Alpha Version 7.3-2 or earlier will experience
some MONITOR drift and should be prepared to deal with it by exercising caution
downstream during analysis. A
workaround is available for use on earlier versions of OpenVMS. Please contact the author for details if you
feel this would be helpful to you.
There will be a number of
header rows (currently 4 for historical reasons). The first row of TLC-format
files includes important comments about the measurement session in a CSV format. The second row has the calendar start date
of the measurement. The third row has
the start time of the first sample.
The last (currently 4th)
header row will be the column headers naming the individual variables being
measured. This will also be a comma-separated list of values. The first column header in this row, by
convention, includes the text "Sample Time" for TLC-format data files.
Many TLC collectors and
extractors have used an initial text string in square brackets to identify the
collector. For example, the collector
for XFC data uses "[XFC]" as its initial string for each measured dimension such
as Read I/Os per second. Similarly, many
TLC collectors or extractors that have multiple views include the view name in
the initial bracketed string. For
example, MONITOR has many views such as
SYSTEM, IO, LOCKING, and PAGING.
The starting string for the MONITOR SYSTEM view would look like:
"[MON.SYST]". This would be followed by
the metric name, for example "Buffered I/O Rate". While this convention is not mandatory for TLC-format data, it
has proven useful in practice. For
example, more than one collector might use the same text string such as "I/ O
per second" for one of its metrics.
Without the initial string identifying the collector, you would end up
with duplicate column names.
Each sample period will
generate exactly one row in the output. These samples will start in the fifth
row using the current definitions for TLC-format
Commas will separate entries
for each measured variable. If a
particular variable is not available for a sample, a comma will be written
nevertheless as a place holder for that variable. This insures that each logical column of data in the resulting
two-dimensional table lines up and represents exactly one variable. In other words, the Nth variable always will
end up in the Nth+1 column
The first column will have
the date and time as its data value. We
have chosen the convention that the time of a sample represents the time at the end of the sample period. To insure proper synchronization of data
from multiple sources, make sure that you also use the interval end time as
your timestamp value.
Ideally, samples from each
TLC collector will start on major time boundary consistent and modular to its
chosen sampling interval. For example,
when using sixty-second sampling, it proves helpful to start exactly on a one-minute
boundary. Ideally, samples will follow a No Drift pattern and, therefore
they will be evenly spaced, without any missing samples. Where samples from multiple independent
collectors are available, it will also be helpful if they all start and end at
the same time and use the same sampling rate.
By making collection properties uniform, downstream synchronization is
more readily realized. However, the
world is often imperfect, samples are missed, collectors drift, starting times
may differ, and so on. When extracting
value downstream from reservoirs of TLC data, it always pays to be on guard for
imperfections in the gathered data.
This is a fruitful area for future TLC enhancements and improvements.
Wherever possible, limit the
TLC files you create to a maximum of 255 columns since Excel and MS ACCESS have
a 255-column limit. Tools such as TLViz and CSVPNG can easily handle a much
larger number of columns (1000 or more).
If you consider building your own downstream tool to extract value from
TLC files, it will be best if you make sure that you can handle higher numbers
of columns. We have already introduced
and are looking into some further changes in T4 kit collection to keep its
standard number of columns generated under Excel's 255-column limit. Excel offers some useful features that are
not available in other tools, and it's always best when we don't have to
reinvent the wheel.
Rules for generating output
files for extractor programs are identical.
With extractors, the actual data collector may be event driven and continuous rather than having a start time, end
time, interval approach to collection.
For example, T4V3x uses time-stamped event data from the continuously
collected accounting log file to compute the number of logins and logouts in a
given period and then writes the result to its TLC-format data file.
In many cases, new TLC-format
collectors and extractors have been written in rather short order. For example, the first Oracle 7 collector
prototype with about 20 key variables was completed overnight. Other collectors have started with a small
number of variables collected in version 1 and then readily added new metrics
to the collection process as time went on.
What collector do you want to build?
|
 |
 |
|
 |
 |
Let's say you have begun to
create daily timeline TLC-format CSV files for your most important systems and
that you have even written a few of your own collectors to capture and save a
timeline history of your most important business metrics. What kinds of things can you do with data
like this that help you manage your performance situation even better than in
the past?
Now that you have timeline
data, the obvious first step is to observe how all your key indicators change
over time. For most people this means
converting the columns of data in TLC-format into visual, colorful, easy to
understand graphs.
|
 |
Graphing Single Indicators, One by One |
 |
 |
|
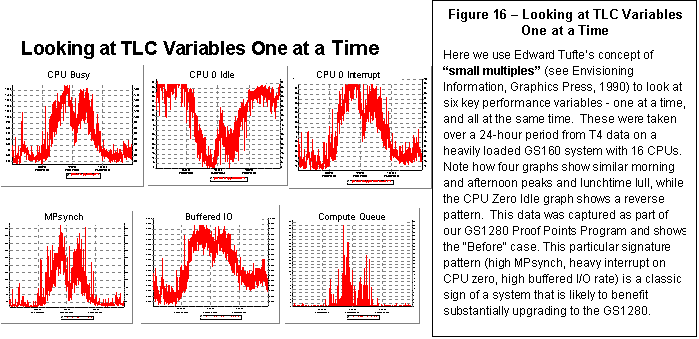
It's of course possible to create very
complicated timeline graphs with dozens of variables represented. There is so much data, so little time, and so
much at stake. We have found that the
place to begin in almost all situations is to look at the shape and pattern of
the timeline curve for each key variable you have collected. We recommend that Step One simply be: graphing single metrics one at a time as shown
in Figure 16.
Here's what to look for: You are going to look for peaks and valleys
and their duration. You might attempt
to visualize an average value. Be on
the watch for short-lived spikes of behavior and whether these show some kind
of periodic repetitive pattern. Also, watch
for square-wave patterns and pay attention to rising and falling trends. We've already shown an example of visualizing the average and
quite a few examples of peaks and valleys.
The next two illustrations (Figures 17 and 18) show examples of these
two cases: a systematic short-lived spike and a repeating square-wave pattern.
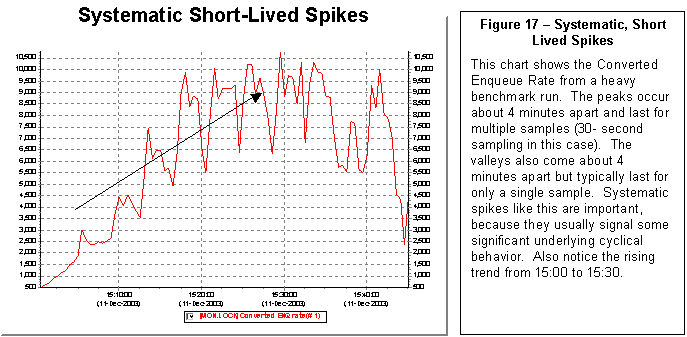
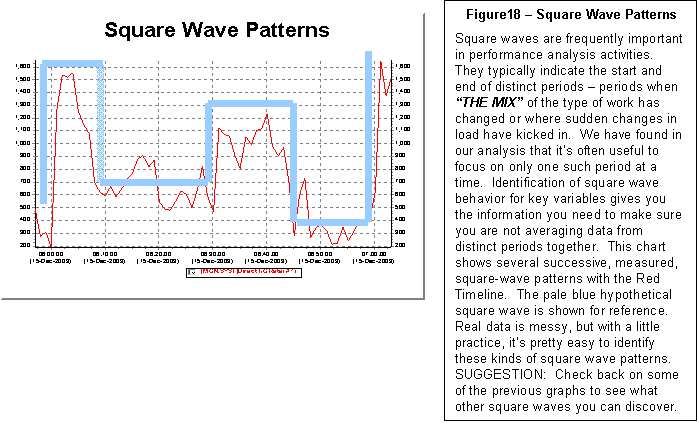
|
Plugging in Local Intelligence |
 |
 |
|
There will always be some
data and information and background intelligence about your system that is not captured
by any one of your current set of TLC-format collectors. For example, perhaps Monday is always the
busiest day of the week for you because a certain kind of backlog builds up
every weekend. Or your disk activity is
highest Friday night, because that's when you always do your full backups. Or your company just ran a full-page
nationwide advertising spread that has quadrupled your call volume on your
inquiry line.
Because it is your system and
your local intelligence information, you and your local colleagues are likely
to be the only ones who are aware of this very special kind of data. As you are looking at the metrics collected,
you will want to bring this very specific local knowledge into the picture as
you try to make sense of what you are seeing.
As you move from graph to
graph, it's often useful to posit hypotheses that try to explain and connect
the patterns you are beginning to see and relate them to your specific
knowledge of the local system.
Quite often a similar pattern
will appear in many graphs, for example, a predictable lowering of activity
during the lunch hour, and a gradual tapering off at the end of the day,
followed by a heavy load when overnight processing jobs kick in, followed by an
early morning quiescent period before the workday begins. Figure 19 is an example of how you might use
timeline charts to identify similar patterns.
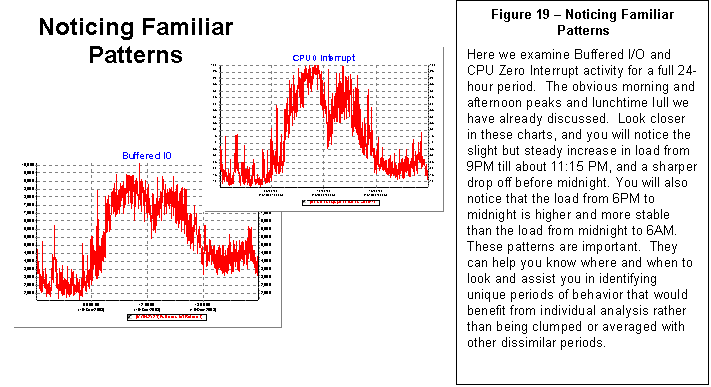
|
Forming More Complex Pictures |
 |
 |
|
After you have taken stock of
key variables one by one, you have mentally prepared yourself for the next step
and are ready to create more complex pictures of the data to test your
hypotheses. The natural thing to do
here might be to graph several variables together at the same time and see if
their shapes overlap or move more or less to the same rhythm. You may want to zoom in on peak periods to
have a closer look at the behavior at that time. In some cases, you may want to stack several metrics together to
create a composite view.
With the right downstream
tools such as TLViz, this analysis work can be done independently or
collaboratively. Groups of two or
three can work simultaneously on the toughest problems. In our small group work within OpenVMS
Engineering and with our customers, we have repeatedly proven the collaborative
benefits that accrue when you the have real-time ability to work directly with
the TLC data to: visualize timeline patterns, point out graphical details to
each other, discuss openly their meaning and significance, and propose and then
check out hypotheses by graphing other related data.
You might also want to try
scatter plots between two related metrics.
When doing this, keep your eye peeled for non-linear relationships (see
Figures 20 and 21) that might reveal a potential bottleneck. You might also watch for signs of multi-modal
distributions of these two variables indicating that the "mix" had changed.
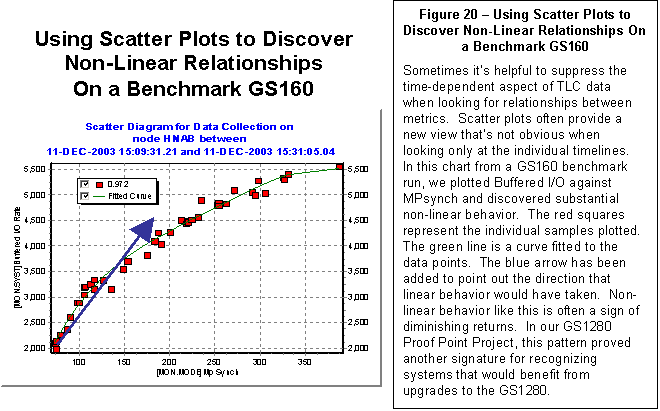
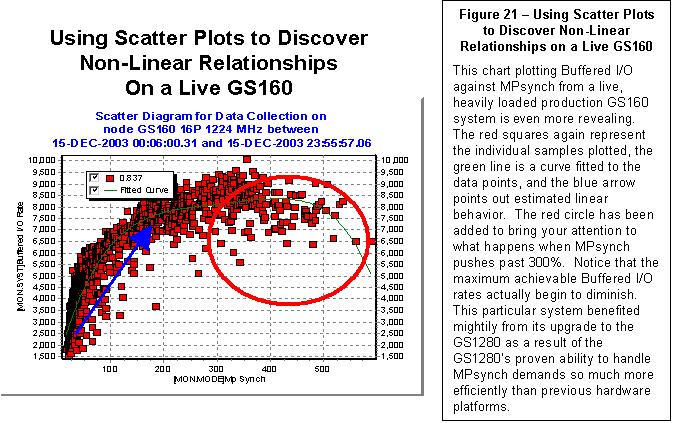
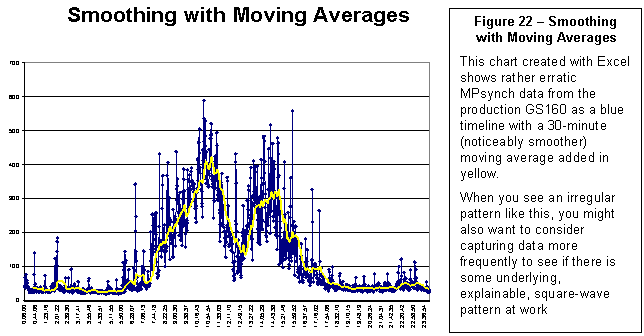
If the data is quite erratic, you might want to
create a moving average to smooth things out.
That way, the overall pattern might be more easily detected. Figure 22 gives an example of how moving
averages can sometimes simplify the overall picture.
Or, you might want to do some
column arithmetic (for example, divide metric 1 by metric 2 to create a new
normalized metric). This can sometimes
prove extremely revealing and help you better understand the points when the
mix changes.
For example, if you took
total CPU busy and divided by the rate of business transactions per second, you
would get a metric that represented CPU consumption per transaction (see Figure
23). Typically, you will want to
represent this value in either milliseconds or microseconds used per
transaction. Of course, it may not be
technically correct that all those CPU cycles actually are directly used for
the measured transactions but that does not invalidate this approach. When the mix stays about the same, our
experience shows that the ratio of CPU to transactions would also stay about
the same. When the mix changes, the
ratio will often change, sometimes radically. When the mix returns to the
original value, the ratio will change back to its original value and
range. This can produce some striking
square wave patterns that are clear visual indicators of a changing mix.
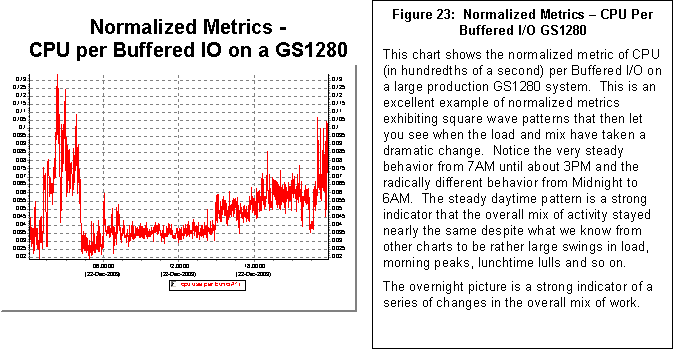
Figure
24, puts the normalized CPU per BUFIO data to good use by combining it with the
Before-and-After technique to reveal patterns that might otherwise have not
been detected.
|
Visual Memory - Your File System is Your Friend |
 |
 |
|
As you go along, you will
find that certain graphs you create stand out and tell an important part of the
story you are forming in your mind. You
are going to want to save these graphs.
These might be saved as named files in WMF, PNG, GIF, JPEG or some other
convenient graphic format for later reference.
If you are working in a tool like Excel, you can save the key graphs on
their own separate and named worksheets.
Whatever tool you are using for analysis, remembering the most important
graphs is an absolutely key step of any such project.
For example, most of the
timeline charts in this report were created using TLViz to generate named WMF
files. These files were later inserted
onto individual PowerPoint slides.
Titles, arrows, and circles, were added as further annotation to produce
a slide that could then be inserted into the Word document for this
article. The time-saving properties of
TLViz to help you find exactly the graphs you want (the graphs that tell the
story about what is happening), coupled with time-saving ways that TLViz can
help you remember this story have proven indispensable on this project as they
have on dozens of others over the past several years.
When you are done with your
analysis, you will often find that you have a dozen or more such graphs and
that you can come back to a data set, weeks later, and remember where you left
off in pretty short order by reviewing your full set of visual reminders of the
work you have already done.
|
Reporting on Your Findings |
 |
 |
|
Once you have completed your
analysis, you will often have a need to present your results to others inside
and outside your organization. This
usually works best when you select a simplified subset of your visual memory
system that fits your audience.
Different audiences quite commonly have different needs. What succeeds and communicates well with a
technical audience of performance experts might not work as well for a
non-technical audience, for example, those with application access to the
system who depend on its rapid response to get their job done.
While you may have used
dozens of graphs to figure out, in depth, what actually happened, once your
analysis is complete, perhaps only two or three graphs with accompanying
captions and explanation will be needed to make your case with others. The remainder of your collection of graphs
will be there as a visual reminder that can be called on as a strong backup for
the case you are making whenever further proofs are needed.
You may wish to come back and
customize or annotate the graphs or create new copies for these purposes, but
you will likely find that a wide audience of both technical and non-technical
people will readily understand your handful of timeline graphical
explanations.
Bottom line:
TLC-format data and the timeline graphs that flow readily from them can
be a powerful visual story-telling mechanism that will get your point across
with maximum effect in the minimum time.
This can be done in documents and PowerPoint presentations. With a tool such as TLViz, the key timeline
data sets can also be shared visually and interactively to tell the story and
to foster further discussion with audiences large and small.
Understanding Change: The Power of Before-and-After
With TLC-format data
collected and saved in a historical archive each day, you are perfectly
positioned to deal with the changes over time on your most important
systems. These changes could be
intentional such as upgrades to new software versions, or such things as
inexplicable slowdowns that have been thrust on you from who knows where.

We have found a simple Before-and-After
technique to be incredibly powerful and full of explanatory magic in these
situations. The basic method is to use
local knowledge of the system in question to select a representative day from
"BEFORE" the change, and a representative day from "AFTER" the
change.
The data for key indicators
from the Before-and-After TLC-format data sets could then be overlaid, one
metric at a time.
The overlay of exactly two
timelines brings into play our powerful human abilities for visual averaging,
for visual comparison, for visual arithmetic, and for visual hypothesis
formation and sanity checking. If
something has changed that impacts performance, that difference will show up
clearly in the overlaid before-and-after timeline graphs for at least some (but
probably not all) of the key metrics.
And the metrics where the changes are most dramatic will invariably give
you clues to what is really going on and why. Figures 25 and 26 on the next two
pages give examples of the power of this approach drawing from two GS1280 proof
points.
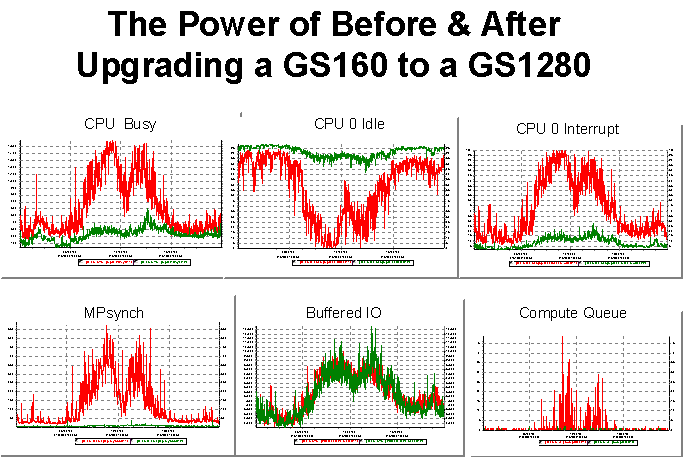

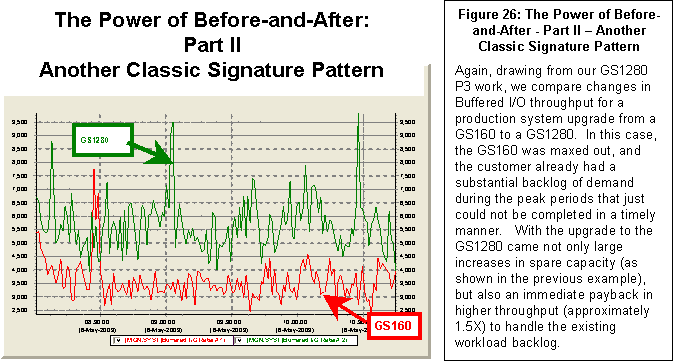
If you haven't already tried
the before-and-after technique, we strongly recommend that you check out how
this approach can help you more fully understand the changes taking place on
your most important systems.
The GS1280 Performance Proof Points (P3) Project borrowed heavily
and benefited mightily from this approach as demonstrated with many of the
examples shown in this article. For
more details about the GS1280 P3, please contact the author.
|
Problem Solving After the Fact with T4 History |
 |
 |
|
 If you have a
case of an unintentional slowdown, it's possible that that the slowdown has
been gradual and that no one had noticed or complained until now. By selecting a number of older data sets and
comparing them to the current performance, it is often possible to pinpoint the
exact day when the change began to creep in.
This can help you figure out what the primary cause was that triggered
the slowdown by checking your system logs for that time period to see what
changes were introduced. If you have a
case of an unintentional slowdown, it's possible that that the slowdown has
been gradual and that no one had noticed or complained until now. By selecting a number of older data sets and
comparing them to the current performance, it is often possible to pinpoint the
exact day when the change began to creep in.
This can help you figure out what the primary cause was that triggered
the slowdown by checking your system logs for that time period to see what
changes were introduced.
Your history of TLC-format
data on your most important mission critical systems can help you determine
exactly when a problem first surfaced (after the fact). This is yet another reason to turn on
timeline collection in advance. You'll
never know when you will need it next.
Those who remember the past are not condemned to repeat it.
|
TLC Data is Ripe for Further Analysis |
 |
 |
|
In addition to all the
wonderful graphical things you can do with the column upon column of TLC-format
data, these columns of numbers are wonderful raw materials for a host of
powerful analytical, mathematical approaches to performance.
For example, using a tool
such as Excel, you can find averages, medians, minimum, maximums, and
percentiles of any stripe with relative ease.
You can compute moving averages of any duration or have them
automatically graphed. You can create
histograms with varying bucket sizes or carry out extensive column arithmetic
to develop important normalized data.
Using Excel or CSVPNG, you
can add up CPU busy or Direct I/O rate across all nodes in a cluster.
With Excel, CSVPNG, and TLViz
you can also carry out linear correlation and discover which metrics appear to
be most closely related to each other in behavior. With any of these three tools and other similar tools, you can
zoom in on a particularly interesting peak period and recalculate correlation
for that window.
With Excel, you can discover
the peak hour or peak half hour for a particular variable. CSVPNG lets you automate the peak hour
calculation.
And if there are certain
systematic calculations that you find useful to repeat with each data set, the
same data will readily yield to customized programming in the language of your
choice once you decide what works best for you.
If you have a many-month
history of TLC-format data for all the nodes in your cluster, you might want to
consider analyzing changing trends that are showing up day-by-day, week-by-week
and month-by-month. No automatic tools exist as yet to transform TLC data in this
fashion but such capabilities appear to be just one or two short steps away.
Once you have data in TNF, the possibilities for analysis are
endless and only limited by the interplay of your time, your imagination, your
aptitude with Excel, SQL, and other available tools, and your programming skill
to craft new tools.
|
From TNF to TNF |
 |
 |
|
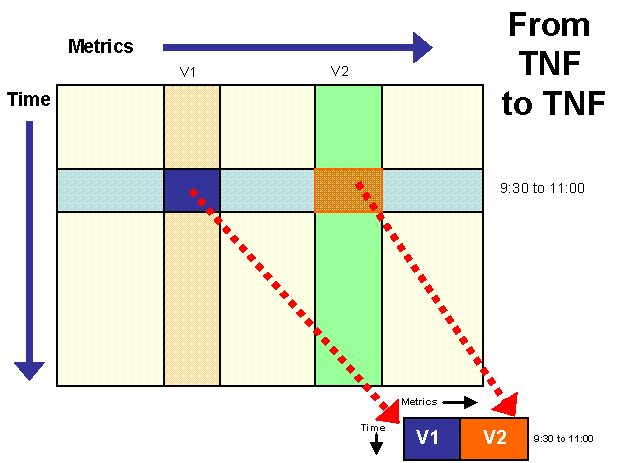
One of the other important things you can do
with TLC-format data is to transform one TimeLine Collaboration Normal Form (TNF) file into another. For example, you might want to automatically
select only a handful of key metrics from each standard T4 CSV file and create
a new file that showed only those metrics.
Or, you might want to see only the time period from 9:30 to 11:00 and
save a new file that included only those 90 rows of data. Or, you might want to carry out both row and
column trimming to create a particularly compact new data set of the most
important variables for the most important time period.

All these kinds of steps are
readily programmable when you start with files in TLC Normal Form. These newer, more compact files are well
suited to email or for upload to central depositories for long-term archival
storage.
When doing analysis and
reporting, we have found that by trimming down our files to their key elements,
the later portions of our analysis work are enhanced and speeded on their way.
In manipulating these files,
we have talked earlier about combining and synchronizing rows of data drawn
from a series of TLC-format data files.
This happens automatically during the standard T4V3x collection
step. The same idea could be used to
create a composite file that showed key statistics from all nodes on a cluster
as well as the aggregate across the cluster.
For other purposes, you might
want to consider creating new TLC-format data by appending new rows to the
bottom of an existing file. For example,
you might try combining all the data for a full week of 60-second samples into
a super-sized file containing 7 TIMES 1440 (or 10,800) rows of data.
The possibilities for
downstream manipulation of TLC-format files to meet special new purposes are
virtually unlimited.
|
What Customers and Partners and OpenVMS Engineers Have Already Done |
 |
 |
|
OpenVMS customers, partners,
ambassadors, and engineers have already carved out some of the possibilities
for downstream use of TLC-format data.
Here is a short list of some of the paths already in use or where the
proof-of-concept has been demonstrated.
- Near real-time data - Harvesting data from collectors in near real-time,
updating TLC-format CSV files, feeding the results to automatic graphing
programs, and publishing them to the web on OpenVMS servers.
- Consolidation - Consolidating TLC-format
data from dozens of systems and making it readily available at a central location
to simplify and reduce the cost of performance management.
- Massive Synchronization - Integrating TLC data from T4V3x tool kit with
Oracle TLC data, customer TLC response data, and customer TLC throughput data
into a single, powerful, multi-dimensional composite picture of OpenVMS
performance on mission critical production systems.
|
 |
|
 |
 |
Many opportunities
await. While we have been making
improvements and additions for over 3 years, there appears to be a long list of
opportunities for squeezing even more value out of the T4 & Friends
collaborative approach by adding new and important collectors to extend the
standard collection kit, by crafting new downstream tools, and by encouraging
an ever widening number of OpenVMS customers to join the party.
Some possibilities for the
coming year include:
- Automatic trending over time (weekly, monthly, or yearly trends).
- Automatic consolidation and reporting of cluster-wide data.
- Development of a growing collection of expert rules for automatically examining large storehouses of collected data.
- Automation of central depositories for those with many systems to manage.
- Built-in capabilities for near real-time reporting.
- Built-in hooks to simplify publishing to the web.
- A whole host of new and powerful collectors that give us visibility into vital, but currently missing
data and the addition of some of these new data streams to an updated T4
collection kit.
- Integrating some key collectors such as one for Rdb into the standard kit.
- More powerful capabilities for creating explanatory visual stories.
- Automatic report generation.
- Simplified adding of customer business timeline metrics to the standard T4 kit.
We would love to hear your
ideas, plans, and accomplishments at extracting more and more value from TLC-format
data.
|
 |
 |
|
 |
 |
Thanks to the widening use of
the available T4 tool kits, we are now seeing steadily filling reservoirs of valuable
TLC data on more and more OpenVMS production systems. Coupled with the increasingly numerous and powerful downstream Friends
of T4, these databanks have so far produced dramatic, visible productivity
gains for OpenVMS Engineering, for OpenVMS Ambassadors, and for an increasing
number of OpenVMS customers and partners.
The net result has been a dramatic improvement in our ability, our speed
and our productivity in extracting real value from performance timeline data.
Progress in advancing this
universal timeline-driven performance work on OpenVMS continues. Significant
contributions are now beginning to flow in from our customers, partners and
ambassadors. The year 2004 holds
promise that we can build on the gains achieved in the past three years with
our universal collaborative approach to OpenVMS Performance issues.
With the public availability
of T4V2, T4V32, T4V33, and SHC, all OpenVMS customers and partners can now
begin to join in, benefit from the advances, and contribute to future
enhancements in collection and in value extraction.
The following points are
worth noting:
- Any important source of timeline data can be
harnessed to produce potentially synchronizable TLC data (either directly or by
later extraction).
- TLC data is readily reusable and readily
programmable.
- Complex systems exhibit complex, time-dependent behavior
that often can best be understood by visually examining that behavior.
- The timeline graphics created in this way are
accessible and understandable by both technical and non-technical viewers. The timeline graphics encourage
communication, discussion, and collaboration among all the interested
parties. We have found that tools such
as TLViz make it possible for those with the most at stake in maintaining good
system performance to conduct a first level review of the data on their own, and
to question results presented to them, even if they are not themselves performance
analysis experts.
- The growing reservoirs of TLC data mean that when
questions arise, it's always possible to go back to the actual data for second
opinions and further analysis.
- The time-saving T4 & Friends approach described
in this article and all of the upstream and downstream tools we have developed
have grown out of this set of principles combined with the central idea to use
the currently abundant resources so as to conserve the scarcest resource - our
personal time.
|
 |
 |
|
 |
 |
The rapid evolution of T4
& Friends owes its success to the work and creativity of many
individuals. This has been a powerful
on-going collaborative effort by the human "Friends of T4" including Tom
Cafarella, Kevin Jenkins, Ian Megarity, Pat McConnell, Chris Brown, Matt
Muggeridge, Paul Lacombe, Pat Moran, Michael Austin, Grant Hayden, Norm
Lastovica, Debess Rogers-Grabazs, Guy Peleg, a whole raft of OpenVMS
Ambassadors including Ray Turner, Dave Foddy, Kevin Fitzpatrick, Aage Ronning,
and Jiri Kaspar.
Many, many others have played
or are still playing active roles in the process. This includes: Sue Skonetski, David Klein, Kent Scheuler, Tom
Moran, Peter Provencher, John Defilippo, Jim McLaughlin, Craig Showers,
Christian Moser, Greg Jordan, Richard Bishop, Melanie Hubbard. Thank you all. Your efforts have really made a difference for OpenVMS.
Here's a brief rundown on
some individual contributions to this evolving story.
Tom Cafarella (OpenVMS
Engineering) wrote the Original T4 extractor tool in DCL. This gave us the proof-of-concept that we
needed to continue. Tom has been an
active user of T4 and TLViz and has recently created a prototype no-drift
workaround for the current versions of MONITOR.
Ian Megarity and Kevin
Jenkins (both from OpenVMS Engineering) demonstrated that with some effort, the
Original T4 was reusable by porting it to a new system they were studying. Ian Megarity wrote the first code for
combining TLC-format CSV files from different sources and built many new TLC-format
collectors to grab key performance statistics not available from MONITOR. Ian then went on to create the powerful
T4EXTR utility for squeezing even more timeline data out of MONITOR.DAT files. He followed with T4V32 and T4V33, greatly
extending the scope of variables transformed into TLC-format tables with a
total (today) of six TLC-format collectors, automated history creation, and
many other advances you will find when you download the latest kit.
Kevin Jenkins actively
applied each new T4 & Friends capability as he worked with OpenVMS
customers on their most important performance concerns. His ideas on possible extensions and
improvements often showed up in the next generation T4 kits and everyone
benefited.
Ian Megarity amazed us all
within OpenVMS Engineering when he revealed his Windows-based TLViz program for
analyzing, graphing, and visually reporting on TLC-format data. It proved to be an instant success. It gave the analyst at least an order of
magnitude productivity gain compared to doing similar analysis, graphing and
visual reporting using a tool such as Excel.
Many important activities that take multiple complex sets of keystrokes
and mouse actions with Excel have been replaced by single simple keystrokes or
single mouse clicks with fantastic time-saving benefits to the analyst.
Kevin Jenkins was again an
early adopter and vigorous advocate of TLViz in his work. He found himself frequently opening up a
pair of TLViz windows and comparing the graphs from one TLC-format data set
with the graphs from a second TLC-format data set. Kevin's suggestion to Ian to let TLViz open up more than one data
set and to overlay the timelines automatically has to rank as the single best
T4 & Friends idea so far. Ian
implemented this idea, literally overnight for the first prototype, and the
resulting extremely powerful and easily generated Before-and-After graphs
have proven they are worth their weight in gold for analysis and for explaining
findings to others.
Pat McConnell (OpenVMS
Engineering Performance Group Supervisor) has been another early adopter of T4
& Friends and a key management supporter of the work we have done. Pat has
also prototyped several new tools and developed proofs of concept for new
approaches to managing TLC data and making the best use of it. Pat has been instrumental in supporting
advanced development efforts and experiments for possible new T4 collectors and
extractors. In his own performance work
in the eBusiness space, Pat has experimented with automated report writing
driven by TLC data with output of text and graphs created in PDF. Pat has also begun to integrate the wider
use of T4 collection into our QTV testing prior to release of new versions of
OpenVMS.
Chris Brown (OpenVMS Director
of Strategy) was an early and continuing management supporter of our T4 and TLC
work as we used and developed successive versions of T4 while troubleshooting
serious customer performance problems.
Chris has been active in encouraging customers to turn on T4V3x
collection, so as to improve OpenVMS Engineering's abilities to collaborate
with these customers about their most serious performance issues and concerns.
Matt Muggeridge (OpenVMS
Engineering, Networking) turned the idea of creating a TLC-format collector for
key TCP/IP data into reality in a few short weeks and worked with Ian Megarity
to integrate this new collector into the standard T4V3x kit. Matt's work is a perfect model for how to
build a new collector on top of existing capabilities of your particular layer
of software and then design it so it fits like a glove with the T4 rules of the
game. Matt has also been an active user
of T4 collection as part of his network performance work, including a
willingness to experiment with some of our barely tested new versions.
Pat Moran (HP Mission
Critical Proactive Services and also an OpenVMS Ambassador) has made a
tremendous recent contribution to the T4 & Friends repertoire with the
creation of his command-line driven CSVPNG utility for massaging and creating
new value out of TLC-format data sets.
The powerful set of features and capabilities Pat has built into CSVPNG
are sure to make this relatively new Friend of T4 into a big winner in the
coming year. Pat has also done excellent
proof-of-concept work with the use of PHP, APACHE, MOZILLA and CSVPNG to
publish TLC-format data to the web and to explore doing this not only for
historical data but also for near real time data as well.
Paul Lacombe (OpenVMS
Engineering Director) provided the T4 team the management support and
commitment and encouragement we needed to continue to develop and enhance T4
& Friends as a natural part of our day-to-day jobs. In the early days of T4, all of the OpenVMS
engineers involved reported up to Paul and that made a big difference. Now, thanks to Paul's support, many others
outside Paul's group are plugged in and are contributing to the evolving
process. We are now, together,
extracting more and more value from the TLC data being created on some of the
most important and most mission-critical systems in the world.
Michael Austin (Cerner,
Remote Hosted Operations) has proven how readily our best customers and
partners can customize the basic T4 kit pieces and harness the power for their
own special needs. Michael is doing
amazing things with TLC data and with a variety of ever more powerful
downstream tools. These are useful in
their own right and serve as a demonstration and proof-of-concept for further
extensions and elaborations to the base-level capabilities in the future. Michael has also made numerous suggestions
for possible future enhancements to T4 collection and for useful downstream
capabilities. For more details on what
Michael is thinking about and doing related to T4, launch a GOOGLE GROUP search
on "T4 VMS Austin" or on "What is T4 and what can it do for you"
Grant Hayden (Oracle) built
the proof-of-concept Oracle Timeline collector, literally overnight. Thank you Grant for building the first TLC-format,
database collector. Working together
with Oracle and with one of our customers, we integrated data from this Oracle
TLC collector with customer business data on sales volumes and with T4
collected system data from OpenVMS.
This combination helped us delve deeply into a particularly complex and
difficult set of performance problems.
Norm Lastovica (Oracle)
demonstrated how TLC-format CSV files could be readily extracted from data
captured by Rdb's standard monitoring utility RMU /SHOW STAT. As part of a collaborative Rdb-VMS
benchmarking project, we have been making excellent recent use of this
extractor --merging the Rdb TLC data with TLC data from T4 to create a more
complete picture of our tests.
Debess Rogers-Grabazs
(OpenVMS Engineering Performance Group) built many of the risky experimental
and advanced development tools to test proof-of-concept for some of our next
generation TLC collectors, extractors, and downstream value extraction
utilities.
Guy Peleg (OpenVMS
Engineering and an OpenVMS Ambassador) proved to be an active user of T4 and
TLViz with a willingness to test some of our most experimental versions. Guy has had excellent success in using T4
and TLViz as a powerful customer collaboration tool.
A whole raft of OpenVMS
Ambassadors were early adopters and supporters of T4 including Ray Turner, Dave
Foddy, Kevin Fitzpatrick, Aage Ronning and Jiri Kaspar and many more.
Sue Skonetski deserves
special thanks for helping us share the T4 story and the evolving TLC
capabilities with so many customers and partners at Technical Updates and
Bootcamps over the past two years.
Those interactions helped provide much of the material for this
article. Thank you, Sue.
David Klein and Kent Scheuler
(Cerner) - Dave and Kent were early adopters of T4 collection/extraction
technology in their Performance Benchmarking lab. Dave and Kent have also been instrumental in the rollout of a
Cerner unique timeline-driven approach that makes use of underlying T4V3x
capabilities.
Tom Moran and Peter
Provencher (OpenVMS Engineering) - Tom and Peter were active users of T4
technology in our HP/Cerner performance lab.
This lab is a crucible for performance work with extremely heavy
workloads and many unique and stressful tests.
The continuous use of T4 technology in this lab built up a huge number
of hours of airtime use for T4V32 collection and increased our confidence in
the robustness and safety of using T4 collection more widely.
John Defilippo and Jim
McLaughlin (OpenVMS Engineering) actively encouraged widespread use of T4 collection
among the Cerner customer base and within Cerner itself. Lots of the success of our collaborative
efforts to advance Cerner's unique timeline-driven approach to performance
rests on John and Jim's shoulders.
Craig Showers (OpenVMS
Engineering Customer Capabilities Lab). Craig has been an active voice
encouraging those customers and partners who come in and use his extensive lab
facilities to include a T4 timeline-driven component in the work whenever
performance concerns were involved in the testing, Craig has been instrumental
in spreading the word about the value of T4 to many new customers and partners.
Christian Moser (OpenVMS
Engineering) deserves credit for his amazing work building a series of
trace-based event collection tools that run in SDA and capture detailed views
of vital, low-level OpenVMS performance metrics. These include, for example, his Spinlock Trace utility which can
measure such things as which spinlocks are held for the highest percentage of
time. We are exploring ways to begin to
roll up this data (now that it has been revealed by Christian's trace tools)
into a timeline-based approach, so we can examine the relationships between
spinlock activity, other OpenVMS statistics and any other key metrics captured
by other TLC-format collectors. Watch
this space in the future for some more about this promising area of activity
and collaborative synergy. Christian
has also just added a No-Drift fix to MONITOR for OpenVMS Version 8.1,
correcting this long-standing shortcoming.
Greg Jordan (OpenVMS
Engineering) for his extension adding the ANALYZE capability to the Spinlock
Trace utility. This automated some
messy calculations and made key spinlock metrics such as IOLOCK8 hold time
percentage immediately visible. We're
now experimenting with a prototype TLC-format extractor that takes output from
SPL ANALYZE and turns it into TLC-format CSV files.
Richard Bishop (OpenVMS
Engineering) for his very recent addition to SDA of a WAIT command in OpenVMS
Version 8.1. In the future, this will make the writing of TLC-format collectors
that feed on SDA data much simpler, much more readily controllable at very high
resolution, and substantially lower overhead.
We anticipate we will be creating some prototype collectors that take advantage
of this new feature as part of our performance work for OpenVMS on HP Integrity
Servers. Because SDA has visibility
into many important OpenVMS metrics that tools such as MONITOR never even
dreamed of, there is lots of future potential to tap.
Melanie Hubbard has joined
the T4 & Friends family in the last few months and has had the opportunity
to help a growing number of OpenVMS customers using Oracle to consider putting
T4V3x to use on their systems in a variety of different situations.
If I have forgotten to
mention your contribution, my apologies.
Please drop me a line and let me know so I can update this historical
record and correct it in future work.
|
 |
|