|
» |
|
|
|
|
|
|
|
|
Wolfgang Burger, Technical Consultant HP Service
Ewald Pieber, Solution Architect HP Service & OpenVMS Ambassador
Manfred Kaser, Technical Consultant HP Service & OpenVMS Ambassador
John Dite, Technical Consultant Compinia Gmbh & Co. KG
|
|
|
|
|
|
|
|
This paper
presents the OpenVMS performance and capacity planning solution called HP
PERFDAT. HP PERFDAT performance solution for OpenVMS provides an unprecedented
level of insight into multi-system performance. A complete suite of highly
automated collection, filtering, charting and trend analysis capabilities
provide the user with accurate and complete performance information for
effective performance lifecycle management. The user interface was developed in
close cooperation with customers in order to keep performance data analysis
simple and intuitive and to enable the user to pinpoint performance problems
and to identify their cause without OpenVMS internals knowledge. This article
describes the basic concepts, main components and highlights the most important
features of HP PERFDAT.
|
|
|
|
|
|
Long term measurement and observation of your system is the key to
understanding how well the system performs and is invaluable in identifying
potential performance problems before they become so serious that the system
grinds to a halt so that it negatively affects your business. Thus, performance
measurement should become a routine process of monitoring and measuring your
systems to assure good performance through deliberate planning and resource
management.
Performance management involves:
- Systematically collecting system data
- Gathering and analyzing the data
- Evaluating trends
- Archiving data to maintain a performance history
You will often observe trends and thus be able to address performance
issues before they become serious and adversely affect your business
operations. Should an unforeseen problem occur, your historical data will
likely prove invaluable for pinpointing the cause and rapidly and effectively
resolving the problem. Without past data from your formerly well-performing
system, you may have no basis upon which to judge the value of the metrics you
collect on your poorly performing system. Without historical data you are
guessing; resolution will take much longer and cost far more.
The preceding is the
key initial statement in the HP OpenVMS
Performance Management manual. Similar statements can be found in any
document seriously dealing with performance and capacity management (e.g., ITIL
process).
A prerequisite for
effective OpenVMS performance management is to gather accurate and complete
performance information of all OpenVMS subsystems. If performance measurements
are inaccurate or incomplete, it is very likely that performance root-cause
analysis will fail or lead to wrong conclusions.
Accurate and complete
performance data is a prerequisite but it is not sufficient for effective
performance management. Trend evaluation and data archiving to maintain a
performance history have to be highly automated. Even if just one data file per
day and system gets created by any OpenVMS performance data collector and your
environment consists of only three nodes this will result in more than 1000
data files per year. If data management and trend evaluation is not highly
automated, this has to be done manually, which may involve importing the
performance data file to a utility such as Excel for charting. In case the
amount of data in the performance data file exceeds the amount of data that can
be processed by the target utility, which is very likely, the data file has to
be pre-processed. You will probably have to copy data files from where the
performance data is collected to the node where you analyze the data and to the
node where you finally archive the data. Such manual tasks are time consuming
and, consequently, costly activities. In addition, it may well happen that
these manual trend and data management activities get postponed due to higher
priority system management tasks. This can lead to situations where performance
history is not immediately available when required, or huge amounts of data
have to be processed manually in advance or, the worst case of all, historical
data is lost.
|
|
|
|
|
|
"High available and
high-performance IT services are critical to our business. Thus, we need a
performance solution that supports the performance management process as well
as the root-cause analysis of performance incidents without explicit expert
knowledge time and be cost efficient . . . Such a performance solution has to
be "plug and play" and should perform performance management tasks like
trending highly automated, reliable and without any need of system management
intervention . . . Performance data of our systems have to be available
immediately when they are needed to be analyzed for any reason without any
preceding data management or data pre-processing activities."
This was the key
statement from the head of IT-operations of Austrian Lotteries -- Thomas
M�ller-Guttenbrunn -- when HP and Austrian Lotteries first discussed the key
requirements that a performance solution for OpenVMS should fulfill in order to
provide added value for their system management.
This discussion was
triggered by Austrian Lotteries in 2003 when they started evaluating new
performance solutions for OpenVMS since they found that their existing
performance solution did not fulfill the basic prerequisite to collect accurate
and complete performance information of all sub-systems of the most current
OpenVMS version (OpenVMS V7.3-1 AXP) at that time. They complained especially
about missing XFC statistics and that the performance data provided for the I/O
sub-system were sometimes questionable which in turn made performance root-cause
analysis difficult and sometimes impossible.
The result of that
discussion was the requirements list shown below. After cross-checking the list
with the ideas related to performance management of several other OpenVMS
customers it was used to evaluate alternative performance solutions:
- High resolution performance data collection for
easy root-cause analysis: Especially when analyzing performance issues of the
I/O sub-system it is very often of special interest to know which process
causes heavy I/O load on a device or a specific file. None of the available
performance data collectors available in 2003 provided this kind of
information.
- Completeness of data: The data collector has to
provide sufficient performance information about all sub-systems of OpenVMS
including XFC and LAN and network protocol support.
- Plug and play: Once the performance solution is
installed data has to be collected and all performance management related tasks
like trending and data archiving have to be performed automatically to maintain
a performance history based on predefined profiles, unattended, and without any
need of additional customization work.
- Easy to manage and control.
- Online rule based performance alerting: Online
performance alerting has to support system management to detect performance
anomalies even though their impact does not slow down the overall system
performance significantly so that this remains transparent to the end-user.
- Automated data management without any system
management intervention.
- The ability to manage huge amounts of data (>1 terabyte).
- Single point and transparent performance data
access regardless of where the performance data is stored within the whole
environment via a single common interface.
- Best practice workflow support based on a variety
of statistical functions for any kind of performance analysis task in order to:
- Reduce analysis time.
- Receive feedback about what is going on without expert knowledge.
- Analysis tool that does not depend on the source data format -- adhering to the principle of "Analyze what you get."
- Data analysis without data pre-processing.
- Automatic trend and capacity reporting.
- Archive and housekeeping functionality.
- Open interface to map/import data from
additional data sources (e.g., database, application, storage controllers and
so forth) to guarantee collaboration with other performance data collection
utilities.
- Performance data export capability to CSV files
to guarantee collaboration with existing performance analysis utilities and
charting tools. The format of a CSV export file (date/time format, list
separator and decimal symbol) will be freely definable to avoid re-formatting
the CSV export file before it can be used as input for a dedicated utility
(e.g. Excel - CSV input format accepted depends on the regional settings).
- Data analysis will not depend explicitly or
implicitly on the start time nor on the sample interval of any data collection.
- Easy data transfer of the performance database, or parts of it, for offline analysis.
- Up- and backward data compatibility.
- State of the art graphical GUI for data analysis:
- Easy to handle.
- Intuitive.
- Easy data navigation.
- Online descriptions for all statistics available.
- State-of-the-art graphical features like:
Stack/unstack functionality.
Zoom in/out.
- Shift left/right.
- Data scanning.
- Ability to scale graphs separately.
- Auto, native, and manual scaling capability.
- Data overlay capability (graphs of different time periods can be overlapped to allow visual comparison).
- Correlation- and deviation analysis capability.
- Multi window support for multi screen systems.
- Export capability to Excel.
- Full cluster analysis capability.
- No dependency on any layered product except those available on the OpenVMS installation media.
- No dependency on any third-party product or any kind of shareware/freeware.
Austrian Lotteries
tested T4 and ECP as alternatives to their current solution. None of these
OpenVMS performance solutions fulfilled all the customer's requirements to the
full extend. Thus, HP Austria decided to develop a new performance solution for
OpenVMS in close cooperation with the customer.
This was the birth of
HP PERFDAT performance solution for OpenVMS.
|
|
|
|
|
|
When we look at the
performance management process and at the requirements listed above, it is
obvious that any performance solution consists of two major categories of
components - those that collect performance data and those that process
performance data (data trending, performance history maintenance, and so on) in
a highly automated fashion. From the software design point of view, the key
requirements are different for the data collecting and data processing
components.
Performance data
collectors have to provide complete and high-resolution performance data
consuming as little system resources as possible. There is nothing worse in the
context of performance data collection than that the data collecting process
becomes the top consumer of system resources but does not provide the level of
insight required.
When we designed HP
PERFDAT, the top requirement for the data processing components was
reusability. Reusability in this context means that a service provided by any
of the data processing components can be applied to any data source. This can
only be achieved if performance data is provided in a standardized format to
the data processing service. Thus, data processing services have to be
completely decoupled from the file and record structure of the data files
provided by the performance data collectors. It was clear to us, that if we
were able to decouple the data processing services from the source data format
data access, problems related to version incompatibilities would never arise
and the set of data processing components would be easily extendable.
Thus, during the
initial design phase we were focussed on:
- Developing a high-resolution OpenVMS performance data collector
- Designing a generic data access model and, based on that, developing a common query interface
This section describes
the major challenges we faced during the development of these two core
components of HP PERFDAT and provides some insight into their design. Features
have been added to both components over time but the base design remains
unchanged.
HP PERFDAT OpenVMS Performance Data Collector |
|
|
During the design
phase we found that there were additional requirements to those already stated:
- High-resolution data collector that provides an unprecedented level of details.
- Completeness of data.
- Low system resource consumption.
These requirements are:
- The ability to handle several performance data collections in parallel:
This requirement derives from best practice considerations on how to use HP PERFDAT
during the design phase. In most cases, a single performance data collection
will be active on a system. Typically, this base collection will not be
configured to collect all performance data that can be provided by the data
collector but only a subset. Under normal condition this would be sufficient to
perform all required performance management tasks and, in most cases, the
performance data provided will also be sufficient for root-cause performance
analysis as well. Sometimes, however, it may be the case that more detailed
information has to be gathered for a defined period of time due to performance problems
or due to just testing new application software. If the data collector were not
able to handle several performance collections in parallel, the base collection
would have to be stopped. As no other data collection is active during normal
operations except the base collection, it will be the source for all automated
performance management related tasks. If the base collection has to be stopped,
data will be missing in its data file exactly during a critical time period
where performance problems were encountered or where software tests were
performed. Thus, this missing data would have to be fetched from a different
source for long-term analysis. This cannot be handled without manual
intervention.
- No sample time drift when collecting performance data:
As long as you analyze performance data from a dedicated data collection for a
short period of time it does not matter if the sample time drifts slowly over
time. If you want to compare this data to performance data from another period
of time or to data collected on other nodes with the same sample interval but a
different time drift, you may get into trouble comparing them and as a result
reach no, or wrong conclusions. Thus, archiving zero sample time drift was a
prerequisite to us (if the selected sample interval is 60 seconds a performance
data sample has to be taken exactly each 60 seconds and not 60.6 or 61.2
seconds).
- Performance data has to be collected simultaneously from all OpenVMS sub-systems:
If the time spent to gather all performance data from all OpenVMS subsystems is
not negligible compared to the sample interval of the data collection (e.g.,
0.5 seconds elapsed time to gather the performance data of a 2-second sample
interval) you may get into trouble trying to analyze the data since the system
state may have changed during the collection period.
- Files are referenced by their file ID and thus
file IDs are available from OpenVMS data structures but no file names. To
analyze I/O performance data of files one would rather request the file name than
a file ID. To provide file name information the data collector has to maintain
its own file name cache.
- Manageability.
Performance data can
be collected by using the MONITOR utility or by the use of system services such
as $GETRMI, $GETSYI, $GETJPI, $GETSPI (undocumented) and so on. The MONITOR
utility as well as system services provide detailed performance information for
particular subsystems. The problem is that this is not the case for all OpenVMS
subsystems such as XFC, LAN, and network protocols and no interface exists that
provides device I/O performance information on a per-file and/or per-process
basis. One has the option to use the MONITOR utility and wrap some additional
tools around it as T4 does, but in this case the requirements of:
- No sample time drift
- Simultaneous data collection
- Manageability
- Running several collections in parallel
can hardly be
fulfilled. Thus, we decided to develop a single-process data collector and not
a set of collector tools.
At first glance,
extensive use of system services to collect performance data seems to be a good
idea. System services are stable and are easy to use. On the other hand, the HP
PERFDAT OpenVMS data collector has to provide highly detailed performance
information but, at the same time, consume as few system resources as possible.
Each system service call causes additional overhead compared to fetching the
same information directly from OpenVMS data structures. Thousands of system
service calls may be necessary whenever a performance data sample is taken. For
example, if you want to collect process performance information for all
processes active on a huge system with 4000 concurrent processes, 4000 $GETJPI
calls are required. This increases CPU load and the elapsed time to collect
performance data. In this case, system services are used significantly compared
to fetching the same performance data directly from the OpenVMS data
structures.
This was the main
reason we decided not to use system services but to fetch performance data
directly from the data structures. In addition (almost) simultaneous data
collection is more likely to occur compared to using system services since the
run-time to collect data is much shorter. Most of the data fetches are
performed at elevated IPL to prevent being re-scheduled during that period of
time.
Not all performance
data can be collected by actively gathering data from the data structures of
OpenVMS. Device I/O performance data can be collected by using the call-back
mechanism provided by the OpenVMS PMS subsystem. This feature tracks
information about each I/O performed on the system. Special data structures and
buffers have to be provided to OpenVMS to trigger the call-back mechanism. Once
the call-back mechanism is enabled OpenVMS inserts information about each I/O
performed on the system into these buffers. Up to 4 records are inserted per
I/O, each at a different stage of the I/O flow. All information is provided to
break down the I/O to devices, files, and process. Once a memory buffer is
full, the collecting process is triggered to read and evaluate the entries in
that buffer and OpenVMS switches to the next free buffer, if available, and
proceeds to write I/O information. If OpenVMS finds no free buffer, the I/O
information is dismissed. Thus, it is important that the calling process starts
reading and evaluating the I/O information provided in the buffers immediately
whenever it is triggered in order to guarantee that at least one free buffer is
available to OpenVMS.
If the collecting
process were single threaded, evaluating the I/O information buffers could be
delayed due to other activities of the process, such as gathering other
performance data or writing the data to the file.
The HP PERFDAT OpenVMS
data collector was designed from the very beginning as a multi-threaded
process. It consists of seven detached threads (see Figure 1):
- Active data sampling thread polling raw performance data but I/O information periodically.
- Reactive I/O sampling thread that exclusively evaluates the I/O information provided by the OpenVMS PMS sub-system.
- Three data collection worker threads processing the raw data provided by the active and reactive data sampling thread and writing this data to a file.
- Management thread that provides information to a
management utility via mailboxes. It provides information about the actual
status of all active collections, triggers collection startups, coordinates all
other threads when a collection is requested to be stopped and is responsible
for synchronized thread termination when shutting down the whole performance
data collection process.
- File name resolving thread.
Figure 1 - HP PERFDAT OpenVMS data collector thread and cache layout
If a data collector
process handles more than one data collection, you have the option to gather
all required performance raw data separately for each collection. This is not
efficient, however, since it is very likely that data sampling for all active
performance data collections are periodically triggered at the same time. This
means that the same kind of data is requested by each data collection and data
is gathered unnecessarily. It is more efficient to have the raw data sampling
threads separated from the "worker" threads as we call them. The sampling
threads are triggered whenever the sample interval of an active data collection
expires. If the sample interval of different collections expires at the same
time, all performance raw data requested by each performance data collection is
collected just once and inserted into the global raw data cache for
post-processing.
With this design, the
number of collections that can be active in parallel is just limited by the
number of worker threads started. The current version of the performance data
collector starts three worker threads. Thus, up to three data collections can
be active in parallel.
The raw data cache is
one of the most important components of the OpenVMS data collector and it is
the key to the high efficiency of the collection process. To avoid
synchronization delays when accessing data in the raw performance data cache,
the cache is separated into a read and a write section. The read section
consists of thread-specific regions each exclusively accessed by each of the
worker threads. The write section consists of a region that is exclusively
accessed by the active data sampling thread and one that is exclusively
accessed by the reactive-I/O sampling thread. This means that thread run-time
delays due to raw data cache synchronization can be avoided.
In most cases, data
gathered from OpenVMS data structures are absolute counter values. When
analyzing performance, one is interested in the change of these counters rather
in their absolute values. Consequently, the raw data cache has to maintain not
only raw data actually collected but also the raw performance data of the last
sample interval for each data collection. Thus, each worker thread region in
the read section is divided into a current region containing the most recent
data collected, and a historical region that contains performance raw data of
the last sample interval collection.
Once data is requested
from a worker thread due to sample interval expiration the active data sampling
thread is triggered. It fetches data from the OpenVMS data structures and
inserts it into its write-cache section region. In addition, it triggers the
reactive-I/O sampling thread to dump the I/O data collected into its private
region of the write-cache section. As both collection threads have signaled
completion of their operation the content of both write regions is moved into
the current regions of the read section of the calling threads, which are then
triggered for post-processing. If the current region of a worker-thread read
cache is not clear because the worker thread is still busy processing data of
the last sample interval, then it is not replaced by the content of the write
cache section and the worker thread is not triggered for post-processing. In
this case, performance data will be lost for the actual sample interval in the
data collection processed by that worker thread. All the signaling is done by
event flags. Once a worker thread has completed all of its tasks, it clears the
historical region and swaps its current and historical region.
It is obvious that the
delay in addressing raw cache entries is critical to the overall performance of
the OpenVMS data collector. A mixture of highly optimized hashing and
block-cache algorithms is used to guarantee that all cache entries can be
directly addressed or addressed via a minimum of hops. Optimizing all of the
caching algorithms so that the data collector -- even on huge, heavily loaded
systems -- provides in-depth, high-resolution performance information without
harming system performance was the real challenge (For example, one of our
customers uses PERFDAT on a CPU and I/O test system with approximately 3,000
concurrent processes. With 2 GB of performance data collected per day, the CPU
load caused by the data collector is typically less than 6% of a single CPU.)
The worker threads are
responsible for processing raw performance data and converting it into valuable
data for performance analysis while making the data persistent by writing it to
a dedicated file. Performance data files are stored in indexed sequential
files. Each worker thread has to process and store all performance data within
its sample time. Insert speed to the data files is also critical to the
usability of the data collector. For this reason, performance data records are
not written directly to RMS when they are created, but are cached in advance,
ordered by their primary key. Only then are these records inserted in order to
guarantee optimal RMS performance.
The file-name-resolving thread is responsible for file-ID-to-file-name resolution.
As stated previously, OpenVMS provides file IDs when collecting file-related
I/O performance counters. To resolve file IDs to file names synchronously is
not an option since this would slow down the data insertion to such an extent
that the whole data collector would become unusable. Thus, file-ID-to-file-name
resolution is out-tasked to the file-name-resolving thread. Whenever a
file-related data record is written to a file, the file ID is passed to the
file-name-resolving thread. If the file name related to the ID received does
not exist in the file name cache, it passes the file name asynchronously to all
other threads using the LIB$FID_TO_NAME run-time routine and adds it to its
cache. Once the dedicated worker thread has inserted all its records to the data
file, the file-name-resolving thread starts updating the file-name reference
region in the appropriate data file of the worker thread. File names that refer
file IDs that have been received from a worker thread and that are not marked
as inserted into the worker thread's data file will be written. File IDs that
have not been resolved up to that time will be inserted to the data file as
soon they are available. It is guaranteed that the file-name-resolving thread
blocks all data file inserts when the owner worker thread regains activity (the
priority of performance-data inserts is higher than file-name inserts).
The higher the hit rate of the file-name cache
when collecting file-related performance information, the less I/O load is
caused by the data collector during the data collection phase. Thus, when the
data collector is started all files currently known to OpenVMS are pre-cached
before any performance data collection is triggered.
|
Generic Data Access Model and Common Query Interface. |
|
|
|
The second core
requirement of the HP PERFDAT solution for OpenVMS was the development of a
generic data access model and a common query interface. This would guarantee
that data from any source is provided to any component in a standardized
format. Thus, with this approach we would achieve a high level of reusability
of all performance processing services. In addition, we would avoid any data
access problems for all performance processing services caused by version
incompatibilities. Under the envisioned design, any data can be accessed
transparently regardless of which tool created the file or if, for example, the
record format, size, or content changed from one HP PERFDAT release to the
next. Data will stay accessible to any utility that accesses performance data
via such an interface.
A common query
interface that provides generic data access to any kind of data file has to
contain a data abstraction layer that reads the records from the files in
native format and converts them to a standardized format. This is obvious. The
fundamental question, however, is which component of the overall HP PERFDAT
environment should maintain the knowledge of the native record structure.
Knowledge of the native record structure is the key for any data conversion.
One option is to
bundle all required adapters, which, in fact, are software components, with the
data abstraction layer. Typically, one would provide one adapter per data file
type. The more data files of different types (different layout and record
structures) that exist, the more adapters that have to be available. That is
not the key point, however, and we were of the opinion that such an approach
was not sufficient.
In principle, an
approach such as this just displaces the version-dependency problems one would
face if no data abstraction layer existed from the performance-processing
services into the data abstraction layer. If the record format of a source data
file changes, the appropriate adapter has to be changed too. In this case, data
files containing the new data structure are accessible, but you will not be
able to read data in a previous data format. In that case, the data abstraction
layer has to provide both the old and the new adapter. Thus, for any change of
data and/or file format new adapters have to be provided without removing the
old ones. The number of adapter versions will continuously increase over time
and we would end up with a hard-to-maintain data abstraction layer.
The other option is
that the data abstraction layer of a common query interface does not have
explicit knowledge of the record and file structure, but that the information
is placed directly in the source file. In fact, nothing except the source that
created the data files knows the data and record structure better. Thus, we
adhere to the principle of letting the source tell all other components how to
access the data.
All meta-data (field
and record descriptors, data link descriptors, index reference table descriptor
s, and so on) required to access the data is stored in the header of each data
file. The first record in the file is the link descriptor that points to where
to find the descriptors in the file. Those are required for reading specific
data from that file. This is the only structure that has to be common to the
data abstraction layer and the sources of the data files. As long as the
structure of the link descriptor does not change, the data abstraction layer
can access data of any kind. Thus, record structures and data formats of the
data file can be changed at any time without having any impact on the
accessibility of data via the data abstraction layer.
Providing such a data
abstraction layer fulfills all the requirements that are related to up- and
backward data compatibility, but it does not fulfill all the requirements
related to single-point access.
Data files are created
periodically on each node within your environment running HP PERFDAT as shown
in Figure 3. Transparent single-point data access has the following meaning to
us. It is the ability to access all the data files from one single node
regardless on which node the data files are located. This is exactly the
challenge we faced when we talked about transparent single-point data access -
where are the data files located?
Databases like Oracle
Rdb maintain a root file that refers to the storage areas of the database. To
create such a persistent root file for the sum of all data files (we call it
the HP PERFDAT distributed performance database) within your environment is not
possible since all nodes that run HP PERFDAT -- even those that are not members
of a cluster -- would need access to a common disk. The only thing possible is
to create and maintain a root file on each node that refers to the files stored
locally. That root file contains references only to the data files that are
locally accessible which is, in most cases, a small part of the whole HP
PERFDAT distributed database.
Our approach to that
challenge was to design a network abstraction layer that services data queries
similar to the way the data abstraction layer services data file content. The
basic functionality of the network abstraction layer is comparable to routers.
When the networking
abstraction layer starts up on a node (let's call this node the access server)
it broadcasts a root file query to all nodes within the HP PERFDAT community.
All remote nodes that have data files stored locally return their local root
file information. The access server caches the data file information received
and creates a virtual root file (non persistent - memory resident) of the whole
HP PERFDAT distributed performance database (you can also call this a routing
table).
Both the data and the
network abstraction layer were the keys to fulfilling all the requirements
related to data access as described in the pervious section. These two layers
represent the kernel of the common query interface that is used by all HP
PERFDAT data processing services. Thus, all HP PERFDAT data processing services
can transparently access any data independent of the source data format. The
data file may be stored locally or on a server located hundreds of miles away -
it makes no difference to the HP PERFDAT data processing services.
The common query
interface has been extended over time, but the design of these two layers is
still valid and unchanged. A brief description of all components that comprise
the common query interface of the current HP PERFDAT version is provided in the
next section.
|
|
|
|
|
|
|
The prerequisite for
effective performance management is to gather accurate and complete performance
information of any OpenVMS subsystem. If performance measurements are
inaccurate or incomplete, it is very likely that the root-cause cannot be
evaluated when analyzing a performance incidence.
HP PERFDAT provides
today's most comprehensive OpenVMS data collector on the market. It gathers
performance information of any OpenVMS subsystem with an unprecedented level of
detail. It provides, for instance, full XFC support down to I/O-size statistics
per file and LAN and network protocol statistics. It also gives you the ability
to breakdown device I/Os to process and file level.
The main features of
the HP PERFDAT OpenVMS data collector include:
With the multi-threaded HP PERFDAT OpenVMS data collector
up to 3 performance data collections can be performed in parallel - each with a
different level of detail and metrics enabled.
Performance data collections are profile
controlled.
These profiles can be defined offline before
starting a collection.
An auto-start collection profile can be defined
to auto-start a performance collection whenever the HP PERFDAT OpenVMS data
collector is (re)started.
Performance data collections can be started and
stopped automatically, manually, or scheduled to run for a predefined period of
time.
Performance data collections and their profiles
are managed and controlled by the common management utility PERFDAT_MGR.
It collects more than 660 statistics organized in 23 metrics.
The sample interval for gathering performance information of the OpenVMS sub-systems is freely definable (minimum = 1 sec)
Each of the metrics can be enabled/disabled independently.
Performance data collected can be restricted to single/multiple devices, processes, users, images, and volumes.
I/O performance data
(device metric) can be collected with unprecedented resolution. I/O performance data is not only collected per device, but
also, for easy root-cause analysis, it can be collected per process and device;
per file and device; and per process, file, and device on demand. Thus, hot
file statistics as well as the perpetrator of hot files can be identified.
I/O performance data
can be collected for any type of class device (the device metric is not
restricted to disk, tape, or mailbox devices).
Files in the device and XFC metric are not only resolved to file IDs but also to their actual file names.
Complete XFC integration.
Full LAN and network protocol support.
Dynamic resource trimming:
The HP PERFDAT OpenVMS data collector was designed to use the
least amount of system resources as possible since the task of a performance
data collector is to provide all the data required to analyze and resolve
performance problems -- not to cause them. Nevertheless, if data collections
are started with the lowest sample interval possible without any device filters
and all device and XFC options enabled, the OpenVMS data collector may become
one of the top resource-consuming processes on the system. In order to avoid
performance problems due to running HP PERFDAT, the OpenVMS data collector
watches its own resource consumption, and if CPU load and/or I/O load exceeds
definable thresholds, HP PERFDAT automatically increases the collection sample
intervals and/or dismisses metrics according to internal rules.
- New performance data
files are created daily for each active collection or whenever a performance
data collection is (re)started. The daily data flush time can be freely
defined.
- Permits online monitoring.
|
|
|
|
|
|
All data collected by
the HP PERFDAT OpenVMS data collector and the HP PERFDAT SNMP extension is
stored in index-sequential RMS files. As described in the previous sections,
each data collector creates a new file daily or whenever a collection is
started (or restarted). Thus, 1 to n data files can exist per day and
collection. A single data file is called a physical storage area. All physical
storage areas that are created on the same day and that belong to the same
collection (collection profile and node) are called a logical storage area.
Figure 3 presents a graphical overview of the database organization of the HP
PERFDAT distributed database.
Figure 3 - Database organization of the HP PERFDAT distributed database
In addition to the HP
PERFDAT OpenVMS data collector and the HP PERFDAT SNMP extension, performance
data files are created by the auto-trend engine responsible for providing
automated trend and capacity reports. Trend and capacity report data files
contain data of a particular time period - called a report period (day, week,
month, quarter, year) -- defined by the report profile used to create these
reports. At the end of such a predefined time period -- or whenever the definitions
of the report profile change -- a new report data file is created. As with the
data collector, a single report data file is also called a physical storage
area. The sum of all physical storage areas that are created during a report
period is called a logical storage. If the report period is WEEK, for example,
all report data files created during a week make up the logical storage area
for this report.
All logical storage
areas created by the same data collection or the auto-trend engine using the
same report profile make up a collection database. The sum of all collection
databases available within your environment is called the HP PERFDAT
distributed performance database (Fig. 3).
The data files of the
distributed performance database can be stored on any node within your
environment. HP PERFDAT distributed database data is accessed via the common
DQL interface.
|
|
|
|
|
|
HP PERFDAT DQL (Data
Query Language) interface provides a common interface for transparent access to
the distributed performance database. DQL is similar to SQL. All basic query
statements such as SELECT, INSERT, CREATE, and DROP are supported except UPDATE
and DELETE to prevent after-image data manipulation.
DQL provides
single-point access to all HP PERFDAT performance data files regardless of
where the data files are stored within your environment. Even if data files are
literally spread all over the world there is no need for any manual data
transfer or preprocessing to access and analyze performance data. The relocation
or renaming of performance data files has no effect on the accessibility of the
data.
All meta-data (field
and record descriptors, data link descriptors, index reference table
descriptor, and so on) necessary to access performance data in a data file is
stored in the header of each physical storage area. Due to the fact that the
DQL interface needs no implicit knowledge about the internal structure of the
data files, there exists no version dependency when accessing performance data.
Performance data accessed via the DQL interface is always readable independent
of the OpenVMS and/or HP PERFDAT version with which the performance data was
collected; the OpenVMS and/or HP PERFDAT version of the system where the
performance data resides; or the version of the HP PERFDAT GUI used for data
analysis.
Additional features of
the DQL interface are as listed below:
- Ability to map/import CSV formatted performance
data from additional data sources (for example, databases like Oracle Rdb,
applications, and storage controllers) to guarantee collaboration with other
performance data collection utilities. If a CSV file is mapped, the content of
the CSV file can be accessed via the DQL interface as if it were part of the
distributed performance database. In contrast to mapping a CSV data file, if
you import the content of a CSV file to the distributed performance database it
becomes part of the distributed performance data and is automatically handled
by the HP PERFDAT data archiving service. Mapped CSV files are not handled by
the HP PERFDAT archiving service. In addition, only a limited number of
statistical methods and features to analyze performance data can be applied to
mapped CSV content.
- Advanced performance data export capability to
CSV files to guarantee collaboration with existing performance analysis
utilities (e.g., TLViz) and charting tools (e.g., Excel). The format of a CSV
export file (date/time format, list separator, and decimal symbol) is freely
definable to avoid re-formatting the CSV export file before it can be used as
input for a dedicated utility (e.g., Excel - CSV input format accepted depends
on the regional settings).
- Multi file version support.
- Ability to define cluster views.
- User defined statistics:
User defined statistics are calculated values that can, once defined, be accessed as
if they are part of the collection databases. There are several reasons for
defining stored procedures. The most common are:
- You want to normalize data.
- You are interested in special statistics that
are not directly collected by the HP PERFDAT OpenVMS data collector or the HP
PERFDAT SNMP extension but all input parameters to compute these are available.
For example, the average I/O size of disk devices is not directly collected by
the OpenVMS data collector but throughput and I/O requests are. Thus, the
average I/O size can be defined as a user-defined statistic:
Avg. I/O size = Throughput/I/O requests
- Statistics package fully integrated in data
query interface. The query interface is not a monolithic layer but consists of
six components as shown in Figure 4.
- DQL$SRV (DQL server).
- Cluster view engine.
- Stored procedure engine.
- Statistics Package.
- DQL$ command line utility.
- PDBC$SRV (Performance database connectivity server).
Figure 4 - Components of the DQL interface
DQL$SRV (DQL Server) |
|
|
|
The DQL$SRV (DQL
server) represents the data abstraction layer of the DQL interface. This
component directly accesses the data of the performance data stored locally
according to the definitions in the header of the data files. Its main task is
to map the data query command received from the cluster view engine to RMS
calls. Data that is read from the data files is converted into type-independent
format and returned compressed to the calling layer. It handles locally stored
data from the collection databases as well as locally mapped CSV files.
The DQL server is
implemented as an IP service. The listener port number of this IP service is
3879. Thus, any node within your environment can request data from the DQL$SRV.
Up to 99 DQL$SRV connections are allowed per node. Each DQL$SRV process can
access up to 2048 data files concurrently.
|
Cluster View Engine |
|
|
|
The cluster view engine provides the feature
of mapping performance data from different nodes for cluster-wide performance
analysis. Once a cluster view is created, a virtual collection database is
accessible that maps the data of the cluster view members. The advantage is
that such a virtual cluster view collection database can be accessed as if it
were created by the OpenVMS data collector or the SNMP extension. Thus, all
methods and features to analyze single-node performance data are available for
cluster views, too. Consequently, the workflow to analyze cluster view
performance data does not differ from the workflow to analyze single-node
performance data.
In most cases, cluster views will be created
for cluster-wide performance data analysis of OpenVMS clusters. There are no
restrictions, though, that state that only performance collection databases of
OpenVMS cluster members can be members of a cluster view. In fact, any
collection database of any node available can be added to a cluster view. The
only restriction is that all collection databases of a cluster view must be
created with the same sample interval.
Any data query is passed to the cluster view
engine. If the data query requests cluster view data, appropriate data queries
are created for all members (collection databases) of the cluster view. These
queries are sent to DQL$SRV. The data streams received from DQL$SRV are merged
and the merged data stream is returned to the calling layer. If the data query
received contains no cluster view data requests the query is directly bypassed
to DQL$SRV.
|
Stored Procedure Engine |
|
|
|
The stored procedure engine enables you to
define site-specific measures (statistics). User-defined statistics are
calculated values that can, once defined, be accessed as if they are part of
the collection databases.
Any data query is passed to the stored procedure
engine. If the data query requests user-defined statistics, the data query is
modified to request all base statistics necessary to calculate the user-defined
statistics. The modified query is passed to the cluster view engine. Once the
stored procedure engine receives data from the cluster view engine the user
defined statistics are calculated according to the assigned function
(procedure) and the result is returned to the caller.
|
Statistics Package |
|
|
|
Any query is passed to
the statistics layer. The query is analyzed if it contains a statistics
request. If this is the case, appropriate data queries are sent to the stored
procedure engine. The data received from the stored procedure engine are
decompressed, cached locally, processed according to the statistics request,
and the final result is returned to the caller. If the query is a data query,
it is sent directly to the stored procedure engine.
|
PDBC$SRV (Performance Data Connectivity Server) |
|
|
The performance data
connectivity server services data and statistics queries sent by the HP PERFDAT
GUI. PDBC$SRV and the DQL$ command line utility represent the network
abstraction layer of the DQL interface. Its main tasks are:
- Creating a virtual root file (memory resident)
whenever a user connects to the distributed performance database using HP
PERFDAT GUI. The PDBC$SRV retains the knowledge of where the data files are
located and how to access them.
- Passing the data and statistics queries to the
appropriate nodes that host the data files. If the query refers to data files
that are stored on different nodes, the performance data connectivity server
disassembles the query, forwards appropriate queries to the nodes, consolidates
the data received, and returns the result to the caller.
- The performance data connectivity server is
implemented in a similar manner to the DQL$SRV - as an IP service listening on
port 5245. Up to 99 concurrent PDBC$SRV (PC-client) connections are allowed per
node.
|
DQL$ Command Line Utility |
|
|
|
The DQL$ command line
utility, like the performance data connectivity server, is responsible for
transparent access to the data files within the defined community (network
abstraction). The DQL$ utility services interactive DQL requests from the DCL
command line interface. In addition the DQL$ utility provides data content
capabilities and can be used to extract trend and capacity reports from the
distributed performance database manually. The DQL$ utility is scriptable so
you can automate data analysis tasks directly on the OpenVMS system.
|
Performance Database File-name Cache Service |
|
|
|
The performance
database file-name cache service, DQL_NAME, is a valid cache containing file
name and particular file header information of all data files stored in the
distributed performance database throughout the whole environment. It provides
this file name and file header information to the components of HP PERFDAT that
access performance data via the DQL interface.
The file name cache
guarantees low database connectivity time when a user initially connects to the
distributed performance database even though thousands of data files may be
spread over all the systems of your environment.
|
HP PERFDAT Statistics Package |
|
|
|
Effectively managing
system performance starts with understanding what is normal and abnormal for
your environment.
Based on the
historical performance data automatically maintained by HP PERFDAT, the
statistics package provides various statistical methods to distinguish between
normal and exceptional system behavior. These methods enable you to spot
deviations quickly and easily. Deviations may indicate problem areas or just
identify opportunities for performance improvements. In addition, the
statistical methods available support the efficient filtering of the statistics
and parameters that characterize your system most accurately.
The statistics package
is a part of the DQL interface. Thus, it is available from the GUI as well as
from the command line interface (DQL$).
The advantage of
having the statistics package as a server-based implementation is that no
massive data transfer between the access server and the PC-client running the
GUI is necessary to receive the results. Thus, network load does not increase
due to statistic queries. In addition, it is guaranteed that the runtime of a
statistic query is (almost) independent of the server location (it does not
really matter if the server is located locally or 100 miles away) and the
bandwidth of the network.
The statistical functions implemented are:
- Min/max calculations.
- Mean value calculations.
- Standard deviation.
- Correlation.
- Integral and mean value based deviation calculation.
Elements can be
ordered by any statistics of the metric. This means that the elements are
displayed in ascending or descending order based on the percentage of the
overall load defined by the statistics caused by each element. The time range
is freely definable.
|
HP PERFDAT Online Alerting |
|
|
|
The online performance
alerting subsystem provides real-time alerting capabilities. It supports system
management to detect performance anomalies in real time. Because it does not
slow down the overall system performance significantly, it is transparent to
the end-user. Online performance alerting can be enabled for any active
performance data collection independent of whether the data collection is
performed by the OpenVMS data collector or the SNMP extension.
Once online alerting
has been enabled for an active performance data collection, the alerting
subsystem tracks the actual values of specific statistics collected by the
OpenVMS data collector and the SNMP extension and triggers alerts if any alert
condition is found to be true.
The statistics to
monitor the alert conditions and the alert method are defined by alert blocks
within an alert definition file. The prerequisite for enabling online alerting
for an active performance data collection is that a valid alert definition file
exists. An alert definition file is an easily customizable text file.
During HP PERFDAT
installation, predefined alert definition files are provided. They can be used
as template configuration files to create your own alert definition file or
used directly to enable online alerting for appropriate performance data
collections.
|
|
|
|
|
|
|
HP PERFDAT provides
automatic data management capabilities. The HP PERFDAT archiving service
carries out the archiving and housekeeping tasks reliably and unattended. All
tasks performed by the service on any node within your environment are listed
in order below:
- If an archive node (see HP PERFDAT environment
section) is defined within your environment, all closed performance data files
stored locally are moved to the archive node.
- Data collection file cleanup:
- All data collection files stored locally with a
creation date that has exceeded the keep-time
are deleted in order to save disk space. Data collection file cleanup only
affects performance data collected by the OpenVMS data collector and the SNMP
extension.
- Trend and capacity reports are not processed by
the archiving service. Trend and capacity reports are kept as long as the data
files are not manually deleted by system management or HP PERFDAT is
uninstalled. Thus, it is guaranteed that the performance history of a system is
available whenever historical performance data is required for analysis.
- If you want to prevent performance data files
collected by the OpenVMS data collector or by the SNMP extension from
being deleted by the archiving service
you can move these files manually to the predefined directory PERFDAT$DB_SAVE
before the keep-time expires. All
data files stored in that directory stay accessible to the DQL interface but
will not be processed by the HP PERFDAT archiving service.
- Log-file and temp file cleanup
- All software components of the HP PERFDAT
environment create log-files when started. All Log-files created by HP PERFDAT
components are purged with /KEEP=5. Thus, the last five versions will always be
available for examination, if necessary.
- After all data management activities listed
above have completed the auto-trend engine is triggered to perform automated
trend and capacity reports.
- Calculating the next time to run the archiving
and cleanup jobs.
The archiving process performs these tasks once a day. The user can configure the following:
- Enable/disable archive processing.
- Time of day that the archive processing starts.
- Number of days that old performance data files will be kept (keep-time).
|
|
|
|
|
|
One of the most
important tasks of performance management is trend evaluation. Trend
performance data is valuable for pinpointing an unforeseen performance problem
and it is a prerequisite for performance prediction while planning for the
future. In order to stay ahead of the curve of how your systems will perform in
the future, you have to be aware of historical performance trends.
With the HP PERFDAT
automated reporting capability which is easy and flexible to configure, trend
and capacity reports are created and continuously updated for any set of
statistics and parameters that characterize your systems -- without any
necessary user action - for the lifetime of your systems.
Trend report data
files created by the auto-trend engine are typically much smaller (1:100) than
the performance raw-data files created by the HP PERFDAT OpenVMS data collector
or the HP PERFDAT SNMP extension. This is because only a subset of performance
data that most characterizes your system is extracted from the raw-data files.
These trend data files are not processed by the HP PERFDAT auto-archiving
service in order to guarantee the availability of the performance history for
the lifetime of the OpenVMS systems. The only way to clean up trend data files
is to delete them manually or to uninstall HP PERFDAT.
Four types of reports
are configurable:
- Trend report.
- Capacity report.
- Day-to-day deviation report.
- Baseline deviation report
Trend Report |
|
|
|
A trend report
compresses the selected statistics that most characterize your system. This
means that the selected performance data is averaged according to the time
compression. The time compression is freely definable, but has to be greater
than the sample interval of the collection that created the collection
database. Thus, if the time compression is set to 30 min you get 48 values per
day and defined statistics in the report profile. The source data has to be
collected with a sample interval smaller than 30 min.
Trend reports are
helpful if the user is interested in detecting changes in system
characteristics over time. If a trend report is created on a weekly basis,
trend report data of week 2 and week 25 can easily be compared with the HP
PERFDAT GUI. From the graphs created by the GUI you can, for example, directly
identify if the level of CPU load on Monday of week 2 is still the same as on
Monday of week 25, or if it has changed. You can then easily examine the way it
has changed. In addition, you can directly identify if the change in the course
of the workload is just limited to a specific day of the week, due to any
system problem on a specific day, or if a workload change can be identified on
each day of week
|
Capacity Report |
|
|
|
Capacity reports are
the basis for capacity planning and forecast analysis. A capacity report
contains a daily value per defined statistics. It is very easy, therefore, to
identify if the workload on a system increases, decreases, or remains stable
over a long period of time. From the performance point of view not all data is
of the same interest. It is common to most systems that there are times it is
idle and times that it is busy. For capacity planning purposes the busy times
are of interest. Thus, up to 5 different time ranges can be defined for a
capacity report to cover these busy periods. Only the data within these time
ranges is used for calculating the average values.
|
Day-to-day Deviation Report |
|
|
|
The day to day
deviation report is derived in a similar manner as the capacity report
(averaging the statistics over the time period defined) but does not store the
average values. It compares the actual average values to the average values for
the previous day and stores the deviation of these average values (%). Such a
report directly highlights on a daily basis whether or not there are
significant load changes within the time periods of interest.
|
Baseline Deviation Report |
|
|
|
The baseline deviation
report performs, in principle, the same calculations as the day-to-day
deviation report. It does not, however, compare the actual average values to
the previous day's values. Instead, it calculates and stores the deviation
between the actual average values and the average values of the same day of the
week from the baseline. Baseline data is a set of performance data files
collected for a system covering a full week. The baseline represents a typical
week where the system performance was considered "normal" based on the user's
knowledge and experience. The baseline has to be defined by the system manager
by moving the appropriate logical storage areas of a collection database to the
predefined directory PERFDAT$DB_SAVE. It does not matter if the data is moved
to this directory on the local node or on the archive node (see HP PERFDAT
environment section). If the baseline does not cover a full week, only the days
of the week are processed that are contained in the baseline. Compared to the
other reports, the time period covered by a baseline deviation report file is
endless. "Endless" means that the report is extended as long as the baseline
data is valid. The system manager can invalidate the baseline data by simply
copying a new set of data to the predefined PERFDAT$DB_SAVE directory and
deleting the old baseline data. In this case, the next time the baseline report
is triggered, the auto-trend engine detects that the baseline data has changed
and a new baseline deviation report file is created.
|
|
|
|
|
|
|
With the
state-of-the-art HP PERFDAT Graphical User Interface (GUI) you can access
performance data from anywhere on the network. Due to the analysis capabilities
provided by the HP PERFDAT GUI, your IT-staff will be able to pinpoint problems
and identify their causes without expert knowledge. The HP PERFDAT GUI helps
you to focus on the most critical performance information, saving valuable
time.
HP PERFDAT GUI
supports a consistent analysis methodology for any performance data.
Independent of which data and how this data was collected, the HP PERFDAT GUI
simplifies the performance management process, reducing the need for training
and improving the productivity of your IT-staff.
The HP PERFDAT GUI is
a Windows tool supported on Windows 2000/2003/XP. After installing the
tool, the only thing you have to do
before starting performance analysis work is to define an OpenVMS access server
that is part of the HP PERFDAT environment (see HP PERFDAT environment
section).
The HP PERFDAT GUI
accesses performance data via the common DQL interface. No data file is
transferred to the PC where the GUI is installed when analyzing data. Only data
that is actually selected for graphing or the result of statistical queries is
transferred. Since no massive data transfer occurs between the OpenVMS access
server and the PC-client running the GUI, it is guaranteed that the network
load does not increase significantly due to data analysis.
The main features of
the HP PERFDAT GUI are:
- Easy to handle.
- Intuitive.
- Data explorer - easy data navigation (see Figure 5).
- The data explorer of the GUI provides a brief online description and the unit of each of the statistics available (see Figure 5).
- Cluster analysis capability:
As described in the previous sections, cluster views are provided by the DQL
interface. Thus, all methods and features to analyze single-node performance
data are available for cluster views too. Consequently, the workflow to analyze
cluster view performance data does not differ from the workflow to analyze
single-node performance data. Cluster views are only marked with a special icon
in order to distinguish between cluster views and performance data collections
of single nodes. (All the following HP PERFDAT GUI screen shots were taken
during a cluster performance analysis session.)
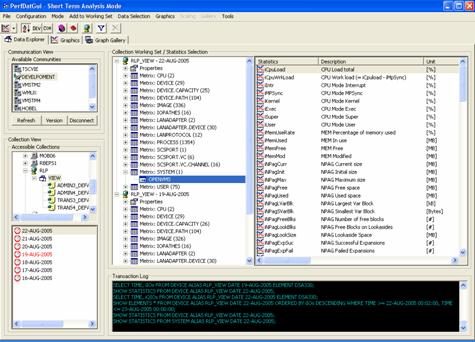
Figure 5 - HP PERFDAT GUI data explorer for easy data navigation
- State of the art graphical features like:
- Stack/unstack functionality
- Zoom in/out
- Shift left/right
- Data scanning
- Ability to scale graph separately
- Auto, native, and manual scaling capability
- Data overlay capability (graphs of different time periods can be overlapped to allow visual comparison)
Figure 6 shows an example of the graphical data overlay capability of the HP PERFDAT
GUI. The I/O rate caused by the RLP cluster (consisting of 4 members - see also
Figure 5) on DSA303 is compared between 19-Jun-2005 and 22-Jun-2005.
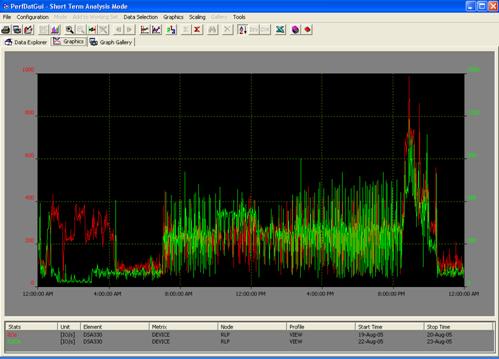
Figure 6 - Example of the data overlay capability of the HP PERFDAT GUI
- Data sorting:
The data-sorting feature can be used to sort elements of a metric by any statistics
of that metric. Thus, it is very easy to identify the top resource consuming
elements. For example, you can sort devices according to the I/O rate. As a
result, the HP PERFDAT GUI displays the devices ordered by their I/O rate and
their contribution to the overall system I/O rate in percent.
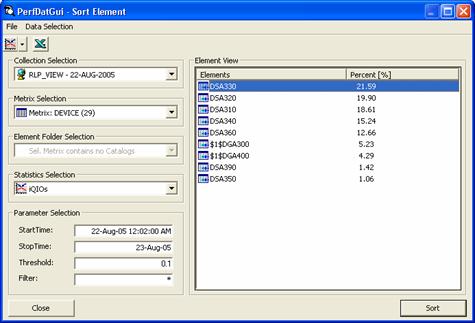
Figure 7 - Example of the data sorting capability of the HP PERFDAT GUI
- Deviation analysis capability:
The deviation analysis feature can be applied to detect any change in the workload
of the system. This makes it easy to validate the workload shift due to any
change (new hardware, new software releases, etc.) to your system or show how
the workload evolves over time on an unchanged system.
One of the deviation analysis features is to create a deviation report that is
especially valuable for "before and after" performance analysis. Figure 8 show
such a deviation analysis report performed for devices. (NoRef means that no
data is available for the device on the reference day, in this example
19-Jun-2005.)
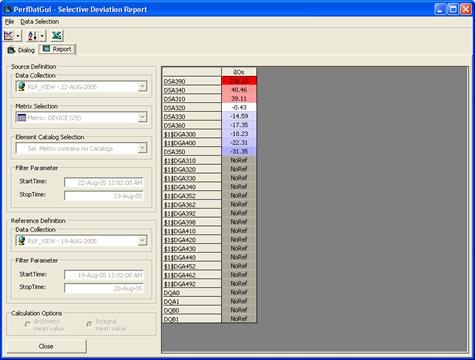
Figure 8 - Deviation report
- Correlation analysis capability:
The data correlation feature can be used for easy dependency analysis. Correlation
reports are valuable for system characterization as well as for root-cause
performance analysis. Figure 9 shows an example of such a correlation report
that illustrates the correlation between the direct I/O rate of all images and
the I/O rate of DSA303 sorted in descending order.
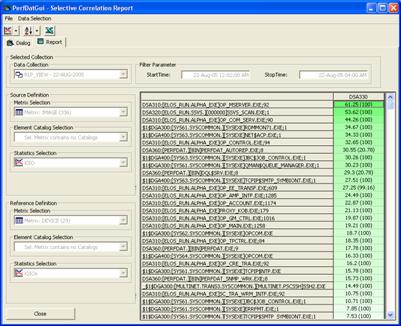
Figure 9 - Correlation report
- Predefined top statistics queries:
The graphical user interface provides a top statistics explorer (see Figure 10).
The top statistics explorer sorts the elements of a metric according to a
selected predefined statistics of that metric, selects the data of the 6 top
resource consuming elements and displays them as a line graph automatically
(see Figure 11). The statistics available in the top statistics explorer are
configured in a text file for simple customization.
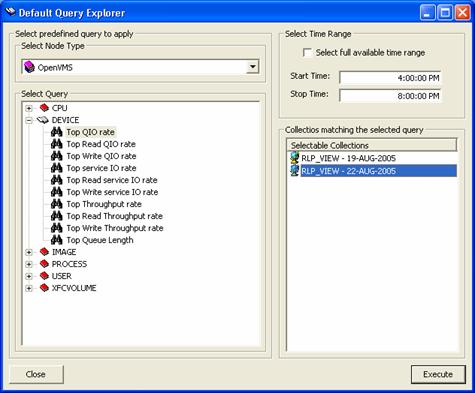
Figure 10 - HP PERFDAT GUI Top Statistics Explorer
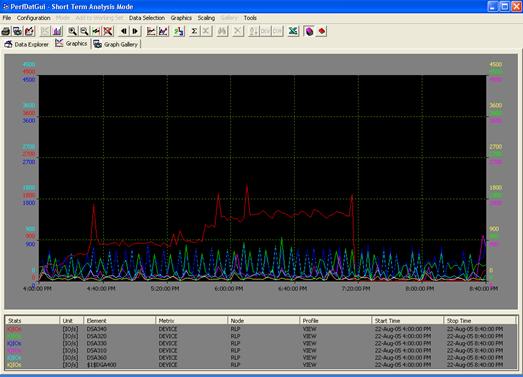
Figure 11 - HP PERFDAT GUI Top Statistics Explorer - graphics output
- Private query explorer:
You can easily define private data queries. This feature supports standard
performance analysis performed on a regular basis. Once the queries for
standard performance analysis have been defined, these queries can be simply
applied to any other performance database that matches the criteria defined by
the private queries and all the standard performance analysis is done. This
saves valuable time compared to having to select all the data manually using
the GUI data explorer whenever a standard analysis is performed.
- Easy to handle cluster view management and maintenance (see Figure 12).
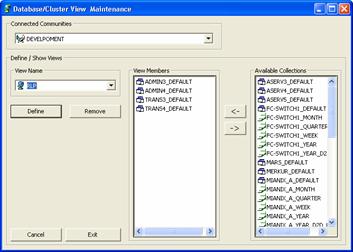
Figure 12 - Cluster view maintenance dialog window
- Multi window support for multi screen systems.
- Export capability to Excel.
- Any graphical output created can be stored
locally on the PC for offline analysis / presentation
(Graph Gallery - see Figure 13).
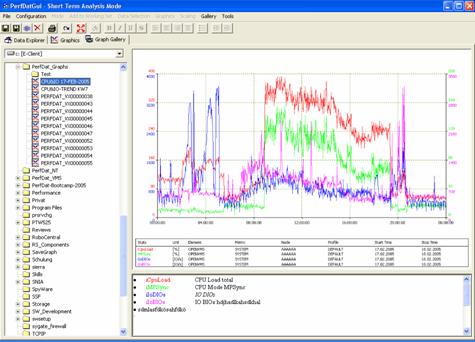
Figure 13 - HP PERFDAT GUI Graph Gallery to view and maintain graphics stored locally on the PC
|
|
|
|
|
|
The PERFDAT
environment consists of so-called communities (see Figure 14). A community is a
logical partition of the whole environment and defines the database view when
accessing the data via any system within a community. All systems of particular
interest can be configured within the context of a community. No rules exist
that limit the configuration of such communities (such as cluster boundaries or
location of the systems). The number of possible communities ranges from one to
the total number of systems within the whole environment. Figure 14 shows an
example of partitioning the environment into communities and the role of the
systems within the communities.
The role of the
systems within a community is defined by the software components running on the
systems.
- OpenVMS collector system.
- SNMP agent system (collects data from SNMP server systems).
- Archive system.
- Access server.
- SNMP server system (provides performance data via SNMP).
OpenVMS Collector System |
|
|
|
A system is an OpenVMS
collector system if the HP PERFDAT OpenVMS data collector is running on that
system.
|
Archive System |
|
|
|
A system is called an
archive system if the HP PERFDAT Archiving service is configured on HP PERFDAT
OpenVMS collector systems and/or SNMP agent to move collection data files to
this system periodically.
|
Access Server |
|
|
|
A system is called an
access server, if the Data Query interface (DQL) is configured and started.
|
SNMP Server System |
|
|
|
An SNMP server system
is any non-OpenVMS system that provides performance data via SNMP and is
supported by the SNMP extension.
As shown in Figure 14,
an OpenVMS system configured within the PERFDAT environment can play several
roles - it can be an OpenVMS collector system, a SNMP agent system, an archive
system, and (not shown in Figure 14) an access server.
The main reason for
defining communities is to have a selective view on the data when accessing the
performance database via an access server. If you have configured your
environment as shown in Figure 14, for example, and you access the performance
database via any node of community C, all data collected by the community
members is visible, regardless of where the data is actually stored within the
community.
Accessing data via a
collecting node provides a community-specific view of the distributed
performance database. This behavior changes if the access server is an archive
node. In this case, access is granted to all data stored locally regardless of
whether the data files were created by any community member or not.
|
Community Example: |
|
|
|
Looking at Figure 13,
there is one node that is the archive node for community A and B, but it is a
member of community B only. If you access data via that node the performance
database view consists of all data of community A and all data of community B
that has already been moved to the archive node. Consequently, even if the archive
node is not a member of any community the user can access all data stored
locally on the archive node when accessing the archive node.
If the archive node is
not member of a community this does not imply that the user loses access to the
data already moved to the archive node when accessing a community member. The
archive node defined on the collecting node will always be queried for community
data regardless of whether it is part of the community or not.
There are several
reasons for defining archive nodes:
- Centralized data storage - single backup and
restore location
- The statistic package provides several methods
for advanced data analysis that reduce analysis time and provide the ability to
identify performance bottlenecks without expert knowledge. These methods are
very powerful, but running these methods may cause heavy I/O load on the
system. Thus, if the data is stored on a production system, analysis runs can
increase I/O load significantly and overall system performance may suffer. If
data is stored on an archive node the data analysis can be done without
negatively influencing the production systems.
- The auto-trend engine extracts trend and
capacity reports from performance raw data. It is triggered once a day on any
collecting node within your environment. Depending on the number of reports to
be created automatically and their definition, the auto-trend engine may also
stress the I/O subsystem. If an archive node is in use, only raw data already
stored on that node will be accessed by the auto trend engine. Thus, the auto
trend engine has - as long as the archive node is up and accessible -- no
influence on the performance of the I/O subsystem on the collecting node.
|
|
|
|
|
|
|
New features planned
for the next releases of HP PERFDAT:
- The current release of HP PERFDAT provides an
easy-to-use utility to import Oracle Rdb performance data offline from binary
RMU/SHOW STATISTICS files into the distributed performance database. With the
next release of HP PERFDAT Oracle Rdb performance monitoring will be fully
integrated into HP PERFDAT.
- The next release of HP PERFDAT will contain a
performance advisory report engine. The performance advisory reporting engine
will analyze performance data periodically. If a rule is fired, it will provide
advisories on how to keep system performance on track.
- A future release of HP PERFDAT will contain a
performance data collector for HSV storage controllers.
HP PERFDAT was
developed based on OpenVMS customer requirements and in close cooperation with
customers in order to exactly meet their needs. The HP PERFDAT roadmap is also
triggered by HP PERFDAT customer feedback and requirements. Thus, the roadmap
may change depending on HP PERFDAT customer needs.
|
|
|
|
|
|
HP PERFDAT performance
solution for OpenVMS was developed based on a customer-defined requirements
list. Due to its rock-solid, layered, easily extendable software design we were
able to fulfill all additional customer needs that have been brought up since
its first release by adding new software layers and components within a
reasonable time frame.
HP PERFDAT performance
solution for OpenVMS addresses today's OpenVMS customers most urgent
performance management issues by providing an unprecedented level of insight
into multi-system performance at low cost. A complete suite of highly automated
collection, filtering, charting, and trend analysis capabilities provides the
customer's IT staff with accurate and complete performance information for
effective performance lifecycle management.
Customers in different
business areas - banks, insurance companies, semiconductor industries,
healthcare, lotteries, telecom providers, and manufacturing industries -- use
HP PERFDAT.
For all of them, HP
PERFDAT has proven the added value it provides to system and performance
management. Here are just a few examples:
- A bank faced a problem when the processing time
of the end-of-day jobs increased from one day to the other unexpectedly. Since
they had been using HP PERFDAT continuously they had detailed performance
information about the system. They used the GUI to compare performance before
and after the degradation and thus they were able to identify the root cause of
their problem. The write I/O response time of some (not all) production disks
increased significantly. The reason was that after adding new units on their
storage arrays the write-back cache performance of one of their storage arrays
has degraded significantly for particular LUNs.
- A telecom provider applied a Fibre Channel patch
to their systems running OpenVMS V7.3-2. After rebooting the system the overall
system performance decreased significantly. After a short look at the
performance data provided by HP PERFDAT and comparing the data to data
collected before the patch has been applied, they found that the MPSync rate
had increased dramatically. The fast-path assignments of the Fibre Channel and
network devices had changed. They switched the fast-path assignments manually
and the systems again performed as expected from the end-user perspective. To
prove to the end users that this was the only cause of the performance loss,
they ran some automated performance comparisons using the HP PERFDAT deviation
analysis feature that showed that all OpenVMS subsystems performed in the same
manner after manually switching the fast path assignments as they did before
applying the patch.
- A lottery company upgraded to a new OpenVMS and
middleware version. During the application tests, application processes
sometimes crashed. These process crashes were not reproducible. Sometimes their tests succeeded and sometimes
they failed. The crash and error messages provided by the middleware indicated
that the crash reason was due to resource problems but there was no hint of
which resources were affected. By analyzing the performance data provided by HP
PERFDAT they were able to prove that the process crashes were due to
misconfigured memory parameters -- not OpenVMS quotas but internal middleware
parameters. By adjusting these memory parameters they were able to fix this
problem. In addition HP PERFDAT supported them in tuning their system. They
used HP PERFDAT during all of their testing with high resolution and received a
clear and complete picture of how any configuration changes of the middleware
affected application and overall performance. The tuning phase led to a
configuration set that provides proven optimal performance.
- A healthcare company running a huge system with
more then 3000 concurrent users experienced system performance that degraded
occasionally and unexpectedly during the night. By using HP PERFDAT, system
managers were able to pinpoint the source of the problem. It turned out that
operators - without informing system management in advance -- submitted cleanup
jobs that deleted up to 200.000 files at once from a directory which in turn
caused the response and performance problems.
- Another bank found that the modification date of
the SYSUAF files were being modified periodically although none of the system
management team changed any SYSUAF records. When they first detected this
security issue they used HP PERFDAT to identify the source. They started an
additional data collection that monitored all I/Os from all processes to the
SYSUAF files only. The next time the modification date of the SYSUAF files
changed, the HP PERFDAT performance data directly showed them which process
accessed the SYSUAF files and what type of access was used (Read, Write,
Control I/Os).
In order to help you
get the most out of HP PERFDAT within the minimum of time, the HP PERFDAT
performance solution for OpenVMS is distributed as a service that includes:
- Software usage.
- Software maintenance service.
- Software upgrade service (Right to use new versions).
- Installation support and initial configuration service.
|
|
» Send feedback to about this article
|