|
|
Product Description
|
T4 (Total Timeline Tracking Tool) is a tool that systematically captures, consolidates, and creates a timeline view of important OpenVMS performance statistics. The statistics are collected by leveraging different collectors.
The output
of a T4 collection is a two-dimensional table formatted as a comma separated value (CSV) file. The CSV files and the binary (.DAT) files, generated by collectors such as MONITOR and FC_MON, are packaged into a ZIP file.
The data in the CSV
files is interpreted using analyzers.
T4 captures a wide-ranging collection of statistics by launching the following collectors for each session:
- MONITOR
The OpenVMS MONITOR utility is one of the main collectors used by T4. It collects data on CPU use, IO, memory, locking, and so on.
- TDC
The TDC also gathers performance data for OpenVMS systems and if installed, T4 can use TDC for data collection instead of MONITOR. For more information about TDC, see the TDC home page.
- ACLG
The ACLG collects data on logins and logouts and the duration of processes. ACLG runs at the completion of a T4 collection period and obtains this data from the OpenVMS Accounting Log, if it is available.
- NET_MON
The NET_MON collects data on network traffic statistics for a given network adapter. During the launch of a T4 collection session, you are prompted to select the network adapters, if any, for which you want data to be collected.
- XFC_MON
The XFC_MON collects data on XFC performance.
- LCK73_MON
The LCK73_MON collects data on the dedicated lock manager activity, if it has been enabled. Data includes requests per second, percentage of time the dedicated lock manager CPU is busy, and the average request time and spin time.
- TCP_MON
The TCP_MON collects data on TCP/IP performance statistics. This data includes packets received, packets sent, and megabits received and sent.
- FC_MON
The FC_MON collects Fiber-Channel disk performance statistics. This data includes read I/O, write I/O, total I/O, read transfer, write transfer, and total transfer rates.
- EVA_MON
The EVA_MON collects performance data from EVA storage systems. It uses Vevamon for data collection.
- SPL_TL
The SPL_TL collects spinlock trace data at regular intervals. If the T4$EXPERT logical is defined, this collector is invoked. For more information about T4$EXPERT, see FAQ.
- PEDriver VC
New!
The PEDriver Virtual Circuit(VC) collector collects PEDriver VC characteristics for each node in the cluster. This data includes information about the number of transmits, message size and so on.
- Shadowing VC New!
The Shadowing collector collects shadowing statistics if the SHADOW_SERVER process is present. This data includes the number of bitmap resets, buffered message mode and so on.
- Memory New!
The Memory collector collects memory statistics. This data includes data about main memory, non paged pool, paged pool, global pages, and swapping files.
The analyzers interpret the data and provide a graphical presentation of the statistics collected. The following are some of the popular analyzers:
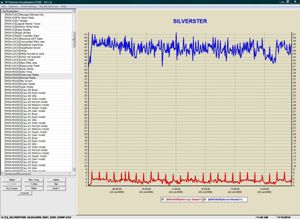
- TLViz
The TLViz is an interactive timeline visualization tool that provides a graphical representation of the data collected for each metric. It is also useful in examining the relationship between two or more metrics.
- CSVPNG
The CSVPNG is a command-line driven tool that helps in generating timeline graphs for metrics. It can also be used for report generation.
For more information about the analyzers, see FAQ.
T4 can help ensure that a detailed, daily performance history of each node is available whenever needed. T4 simplifies observing the variation in the performance of a single node over time.
|